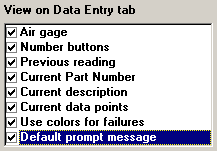
To select the components you want to display or hide during data entry, click the Session menu and then click Data Entry Display.


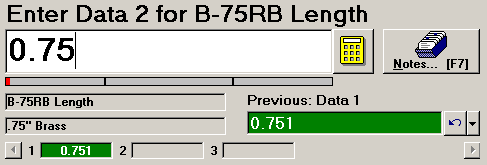
Example components displayed during a data entry session.
When you enter data values from the keyboard, the Air gage gives visual feedback about the data value relative to specification limits or individual gate limits. For more information, see Air Gage.

The number buttons allow you to click on buttons instead of typing on the keyboard. This is especially useful when entering data in PDA mode.

To remove the previous character, click the Back space button ![]() . Alternately, you may highlight one or more characters to be deleted, and then click a button to replace the highlighted characters with a new character.
. Alternately, you may highlight one or more characters to be deleted, and then click a button to replace the highlighted characters with a new character.
To remove the following character, click the Delete button ![]() .
.
To enter the displayed value, click the ![]() button.
button.
|
|
After you enter a data point, traceability value, or standard on the data entry screen, the program moves on to the next prompt and, by default, displays the last value you entered in the Previous field. For more information, see Previous and Undo.

After you select the standard for which you will enter data, the program automatically displays the name of the standard on the data entry screen.
![]()
After you select the standard for which you will enter data, the program automatically displays the description from the standard on the data entry screen.
![]()
As you enter the measurements for a data subgroup, the program automatically displays those measurements on the data entry screen.
![]()
The program can display up to eight measurements at one time. If the subgroup size for this standard is larger than 8, you can view additional measurements by clicking the ![]() and
and ![]() buttons.
buttons.
Use colors for failures
By default, the program uses color on the Air gage, previous reading, and current data points display, based on the real-time failure status of the measurement.
The actual colors used are those you have defined for various real-time failure reasons and for data with no real-time failures. For more information, see Colors and priority.
If a measurement violates specification limits or gate limits for this standard, it is displayed in the color configured for these real-time failures. Otherwise, the measurement is displayed in the color chosen for data without real-time failures.
To display measurements and chart borders with a neutral color instead of the real-time failure colors, clear this check box.
When this check box is selected, the program displays a brief message to the operator above the input box on the data entry screen.

When this check box is cleared, this message is hidden. This setting also improves the speed of data entry.

|
|