Chart Options menu
The Chart Options menu is available when you are working on the Data Entry tab with an active chart window in a data entry session.
You can also access the options from this menu by right-clicking on a chart. In , only the right-click menu is available.
The options shown on this menu will depend on the access rights granted to the User or Group Name you used to log in. These options may include:
This option allows you to change fonts, font properties and colors for a chart. For details, see Changing Fonts and Colors on Charts. (In PDA mode, this feature is not available.)
This option allows you to change the display settings for a chart. For details, see Changing display options on charts.
|
 Note: Changes you make to these settings are only temporary and will remain in effect until the chart is repainted. This can happen in a data entry session that displays multiple chart windows and changes from another chart window to this chart window. Note: Changes you make to these settings are only temporary and will remain in effect until the chart is repainted. This can happen in a data entry session that displays multiple chart windows and changes from another chart window to this chart window.
If you want to change these settings permanently, select the Save as defaults check box and update remaining Chart defaults in the Administration module. Some of these settings can be changed permanently on this workstation by selecting the Save as defaults check box.
|
On control charts, this option allows you to change the way that data points are plotted relative to the y-axis of charts. (In PDA mode, this feature is not available.)
On histograms, this option allows you to change the offset, number of cells, and cell width. (In PDA mode, this feature is not available.)
For details, see Changing Scaling.
|
 Note: Changes you make to these settings are only temporary and will remain in effect until the chart is repainted. This can happen in a data entry session that displays multiple chart windows and changes from another chart window to this chart window. Note: Changes you make to these settings are only temporary and will remain in effect until the chart is repainted. This can happen in a data entry session that displays multiple chart windows and changes from another chart window to this chart window.
If you want to change this setting permanently, you must update it in the standard.
|
Data entry control charts can show control limits for data groups. When data is grouped, the real-time checks will be based on the control limits from the most recent group. This applies even if control limits are not displayed.
When data groups are changed using the Group Data command, the control limits will be recalculated according to the new data groups. For details on using this feature, see Group Data Options.
When the current subgroup defines a new data group – for example, by identifying a new anchor point, traceability value used for data grouping, or date/time period – it becomes the first point in a new data group. Because real-time control limits are calculated from the historical data in the current data group and this is the first data point in that group, no control limits will be calculated or used for real-time checking on this data until the minimum number of subgroups configured for recalculating control limits has been entered for this new data group.
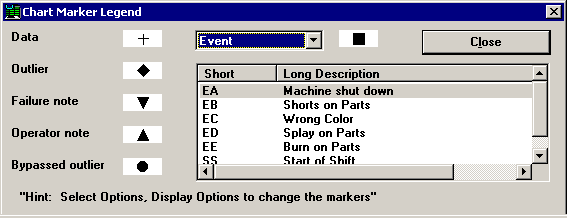
This option is only available for a control chart, or for the control chart portion of a combination chart. It displays a Legend explaining what the symbols and corrective action codes on the chart represent. (In PDA mode, this feature is not available.)

This legend indicates which marker types are used for data points, statistical outliers, failure notes, operator notes, and bypassed data points. It also displays the full descriptions of the shortened Event codes.
To view the descriptions of the shortened Cause and Action Taken codes, click the Event drop-down list and select Cause or Action Taken.
When a control chart with grouped data is displayed on the screen, you can view more detailed information on each data group. For more information, see Viewing details for data groups.
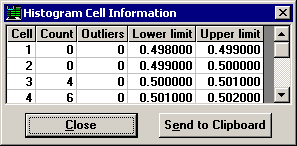
When a histogram is displayed on the screen, this option displays more detailed information on individual cells of the histogram. It lists the cells on the histogram, the number of data points in each cell, the lower limit of each cell on the histogram and the upper limit cell of each histogram. (In PDA mode, this feature is not available.)

You may click Maximize to enlarge the current chart so that it fills the entire chart area in the bottom section of the data entry screen.
When the current chart is already maximized, you may click Restore to return the chart to its previous size.
![]() Note: Changes you make to these settings are only temporary and will remain in effect until the chart is repainted. This can happen in a data entry session that displays multiple chart windows and changes from another chart window to this chart window.
Note: Changes you make to these settings are only temporary and will remain in effect until the chart is repainted. This can happen in a data entry session that displays multiple chart windows and changes from another chart window to this chart window.
