Some information in this topic may be specific to the GainSeeker Charts module.
On a chart containing multiple data groups, you can drill into the data of specific groups you select by creating new charts that only focus on the data for each. You can generate:
A new chart for an individual group,
-or-
One or more charts for specific groups you select.
|
Contents [Hide] |
On a chart containing multiple data groups, you can segregate the data for a single group by drawing a new chart that displays only that data.
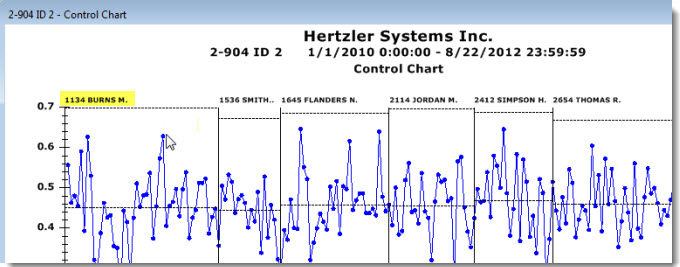
The data in the following example is grouped by Operator, so data for operators Burns, Smith, Flanders, Jordan, Simpson, and Thomas displays. You can generate a new chart for a specific group (1134 BURNS M. in this example) for deeper analysis of just that data. The new chart will be the same chart type as the original, a Control Chart for this example.
To generate a chart for an individual data group:
Right-click any data point on the chart that is within that group.

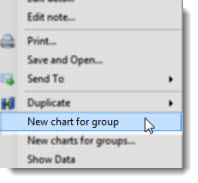
Then, click New chart for group on the right-click menu that displays.
GainSeeker draws a new chart that displays data only for operator 1134 BURNS M. The original chart also remains open on the GainSeeker Charts window.

 The new chart will display only as many data points as the maximum number allowed for each chart in a chart group. The GainSeeker default maximum setting is 1,000 data points (or retrievals) per chart. GainSeeker will retrieve any available data up to the maximum number allowed. This setting can be changed using the Maximum count for retrieval setting.
The data in the following example is grouped by Operator, so data for operators Burns, Smith, Flanders, Jordan, Simpson, and Thomas displays. You can generate one or more charts for specific groups (BURNS, FLANDERS, and THOMAS for this example) for deeper analysis of the data for these operators.

To generate one or more charts for specific groups:
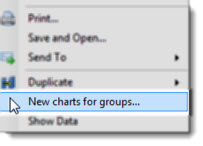
Right-click anywhere on the chart. Then click New charts for groups... on the right-click menu that displays,
-or-
Click Options on the GainSeeker Charts window menu. Then, click New charts for groups... on the list that displays.
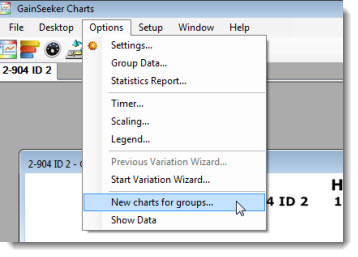
The New Charts for Groups dialog opens. See Using the New Charts for Groups dialog below.
 The new charts will each display only as many data points as the maximum number allowed for each chart in a chart group. The GainSeeker default maximum setting is 1,000 data points (or retrievals) per chart. GainSeeker will retrieve any available data up to the maximum number allowed that is within the set date/time range. This setting can be changed using the Maximum count for retrieval setting.
Use the New Charts for Groups dialog to select the types of charts you want to generate for specific data groups you select.
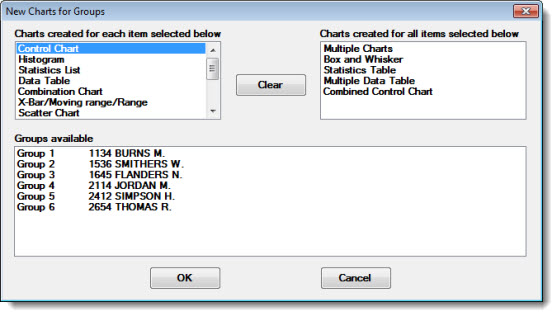
To select groups for new charts:
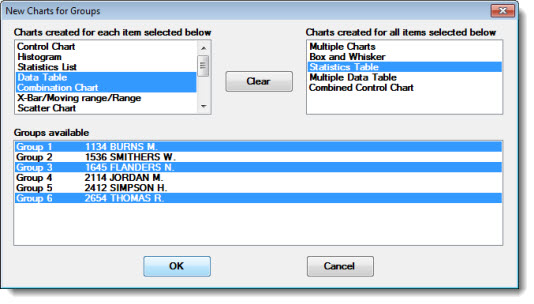
In the Charts created for each item selected below list, choose the types of individual charts you want to draw (if any) for each group you selected. For example, if you select Data Table and Combination Chart, GainSeeker will draw six charts: three Data Tables and three Combination Charts (one each for BURNS, FLANDERS, and THOMAS).
Click a chart type in the list to select it. Then, click and hold the CTRL (control) key while clicking on any other chart types you want to draw.
In the Charts created for all items selected below list, choose which (if any) types of charts you want to generate. Each chart will include data for each group you select. For example, if you select Statistics Table, GainSeeker will draw one Statistics Table that includes the data for operators BURNS, FLANDERS, and THOMAS all in one table.
Click a chart type in the list to select it. Then, click and hold the CTRL (control) key while clicking on any other chart types you want to draw.
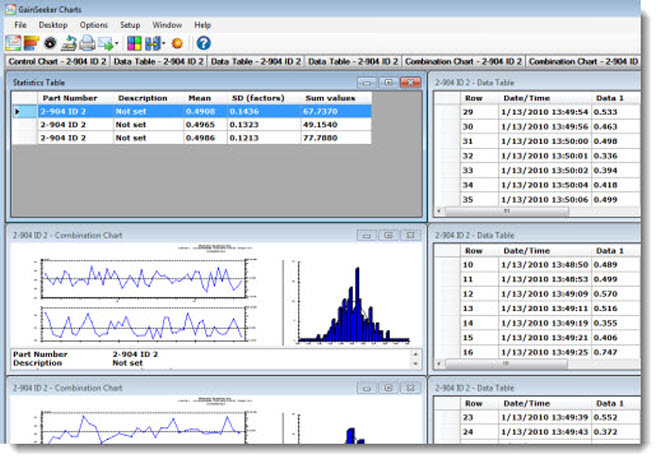
The original chart displays on the GainSeeker Charts window along with the new charts you selected for the specific groups. For this example, three Data Tables, three Combination Charts, and one Statistics Table display on the window along with the original Control Chart (not all the charts are visible on this diagram. The charts in this diagram have been positioned for optimized viewing use the Tile function on the GainSeeker Charts window).
