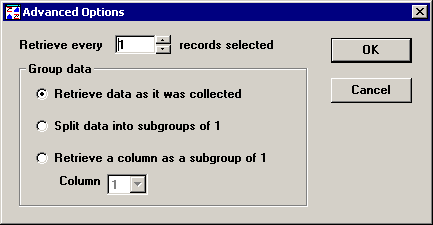
You can set additional options on how to retrieve data for charting and analysis.

Retrieve every n records selected
If you are analyzing a very large data set, you may want to sample that data set for charting and analysis by retrieving every 2nd, 3rd, 5th, etc., subgroup. By analyzing a sample, you are able to gain a historical perspective of your data without getting an excessive amount of data.
For example, if you need to analyze all of the data on one standard during a 12-month period, you might have charts and reports analyzing thousands of data subgroups. Not only will analysis be slow, but it will be difficult to see overall trends on such a crowded chart. If you increase this setting so that every 5th subgroup is included in charts, reports and statistics, you can still get a good idea of how this standard was running during that 12-month period.
Group data
Three options are available for grouping data:
To use the subgroup size configured in the standard, click Retrieve data as it was collected.
To analyze data stored in subgroups as if it were individuals data (data with a subgroup size of 1), click Split data into subgroups of 1.
For example, if you select this option when analyzing 25 data points for a standard configured for a subgroup size of 3, each data point will be broken up into 3 data points. The resulting charts and reports will perform analysis for 75 data points with a subgroup size of 1.
To sample measurements from within each subgroup— e.g., only the first measurement in each subgroup, only the second measurement in each subgroup, etc.— click Retrieve a column as a subgroup of 1 and choose which Column you want to analyze.
For example, if you choose to retrieve the 3rd column when analyzing 100 data subgroups, the resulting charts and reports will perform analysis for 100 data points with a subgroup size of 1.
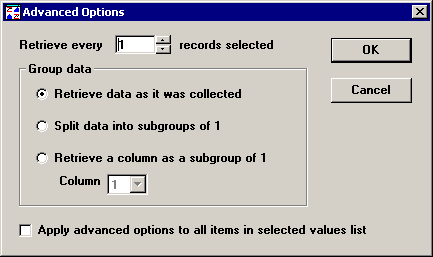
If you selected Analysis Mode 2 on Chart Wizard Step 1, one more option is available:

To apply the selected options to all part numbers or Short Run process specifications that you selected on Chart Wizard Step 1, select the Apply advanced options to all items in selected values list check box.
To apply the selected options only to the values you selected on Chart Wizard Step 3 for retrieval and statistical options, clear the Apply advanced options to all items in selected values list check box.
After making your selections, click OK to keep your changes or Cancel to undo your changes. You will then be returned to Retrieval Options Wizard Step 4.