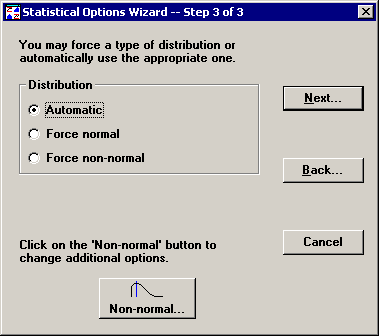
You can choose how to apply normal or non-normal analytical tools to your data.

Automatic
This allows SPC to test the data set for normality. SPC will apply the appropriate statistical analysis to the data set, based on whether its distribution is normal or non-normal.
Normal
This forces SPC to analyze each data set as a normal distribution, even if the data is in fact non-normally distributed. This makes the statistical analysis easy to replicate by hand, but it does not always provide a true representation of your process because you ignore the true distribution of the data.
Non-normal
This forces SPC to analyze each data set as a non-normal distribution, even if the data is in fact normally distributed. This gives the most accurate calculation of the true shape of the curve.
You can set additional options for non-normal calculations by clicking the Non-normal button.
After setting the options on this step, you have several options:
To keep your changes and return to Chart Wizard Step 3, click Next.
To keep your changes and return to Statistical Options Wizard Step 2, click Back.
To undo your changes and return to Chart Wizard Step 3, click Cancel.