![]() Note: When viewing a dashboard where rows are defined by traceability field 7 or higher, this option is not available.
Note: When viewing a dashboard where rows are defined by traceability field 7 or higher, this option is not available.
When viewing a dashboard or a data table, you can use the right-click menu to launch a chart of the underlying data in the SPC Charts and Reports module or the DMS Charts and Reports module.
|
|
Launching a chart from a dashboard
To begin launching a chart from a dashboard:
On a Real-time Failure dashboard, right-click on the cell for which to view a chart.
On a KPI Gage dashboard, right-click on the Dial gage, Bar gage or Dynamic text item for which to view a chart.
On a Statistical Filter dashboard, right-click anywhere on the row for which to view a chart.
On the right-click menu, click Chart.
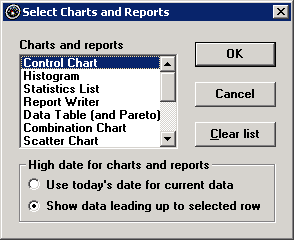
This displays the Select Charts and Reports screen.
|
|
|
|
Charts for DMS data |
Charts for SPC data |
If you are launching DMS charts, select the Retrieval type. If the data being charted contains more than one standard, the option for Control charts is not available.
On the Select Charts and Reports screen, select one or more charts and then click OK.
For more information about these charts, see SPC Charts or DMS Charts.
Launching a chart from a data table
On a DMS data table:
Right-click on any row in the table and then click Chart.
On the Select Charts and Reports screen, select the Retrieval type.
Then select one or more charts and then click OK. For more information about these charts, see DMS Charts.
On an SPC data table:
Right-click on a row in the table and then click Chart.
On the Select Charts and Reports screen, select one or more charts. For more information about these charts, see SPC Charts.
Select a High date for charts and reports:
To chart all data from the first row of the data table to the end of today, choose Use today's date for current data.
To chart only the data from the first row of the data table to the row on which you right-clicked, choose Show data leading up to selected row.

Click OK to launch the selected charts with the selected date range.
Refreshing charts launched from Enterprise Dashboard
|
To refresh the chart while maintaining the correct number of anchor points, you should refresh the dashboard and then launch the chart again. |
Changing configuration
|
|