You can copy the contents of the data group control limit legend to the clipboard or plot its numerical values on a chart.
To send the contents of the data group control limit legend to the Clipboard, click the Send To menu and then click Clipboard.
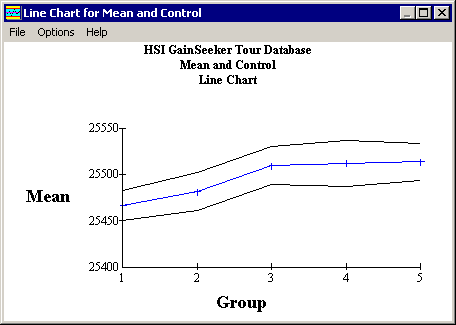
To display a line chart of the average values of the data groups, click the Send To menu, point to Line Chart and then click Mean. To display the data group control limits along with the average values, click the Send To menu, point to Line Chart and then click Mean and Control.

The line chart can be modified, printed and sent to an editor like a regular chart, but it must be closed before continuing. (In PDA mode , the Options menu is not available and the chart cannot be modified.)
A line chart cannot be saved as part of a desktop.