To generate a control chart of one data group, click the data group and then click the Zoom Group n! menu. This menu is unavailable if you have selected multiple data groups or if only one data group exists. This menu is also unavailable in the Data Entry module.
To perform more in-depth analysis of data groups, select one or more data groups and then click the New Charts! menu. This menu is unavailable if no data groups have been selected or if only one data group exists. This menu is also unavailable in the Data Entry module.

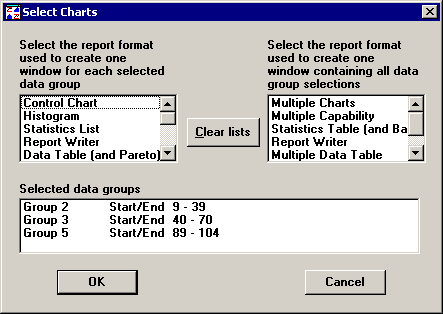
The resulting Select Charts window allows you to select the types of charts and reports to generate for these data groups.

Select the charts and reports you want to view, then click OK.
|
Data set #1: Order by date/time (default)
Data set #2: Same data is retrieved with a filter to sort by Shift
On the group data control chart legend for data set #2, the New Chart! menu and the Zoom Group n! menu will be unavailable if:
|