![]() The Defect Trend
Wizard dashboard control makes it easy to compare defect levels
between two data sets - Baseline and Analysis - to help you detect which
defects have exhibited the biggest changes.
The Defect Trend
Wizard dashboard control makes it easy to compare defect levels
between two data sets - Baseline and Analysis - to help you detect which
defects have exhibited the biggest changes.
For example, you might set up your Baseline and Analysis data sets to compare defects for two different date periods, or perhaps analyze the same date period but different data filters such as Machine or Shift.

|
Contents [Hide] |
You will configure the Defect Trend Wizard with two basic settings:
A Date period and optional filter that defines a Baseline data set
A Date period and optional filter that defines the Analysis data set
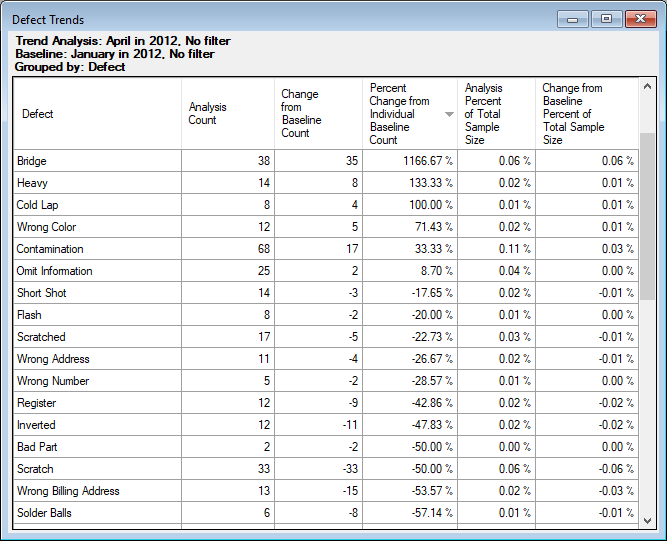
This control then analyzes the defects for each data set and displays the following columns for each defect row:
Analysis Count – number of defects in the analysis dataset.
Change from Baseline Count – difference between analysis and baseline counts.
Percent Change from Individual Baseline Count - percent change in count from the baseline dataset to the analysis dataset, i.e. ((analysis count – baseline count)/baseline count)*100.
For example:
If the baseline count is 10 and the analysis count is 15, then
this column would display 50%.
If the baseline count is 15 and the analysis count is 10, then
this column would display -33.33%.
If the baseline count is zero and the analysis count is non-zero,
then the column would display No Baseline.
Analysis Percent of Total Defects or Analysis Percent of Total Sample Size – you can use the DefectTrendPercentCalculation property (below) to choose which percentage you prefer to display.
Change from Baseline Percent of Total (Defects/Sample Size) – difference between Analysis percent of total and Baseline percent of total.
From a dashboard that is open in design/edit mode, click the Defect Trend Wizard button:

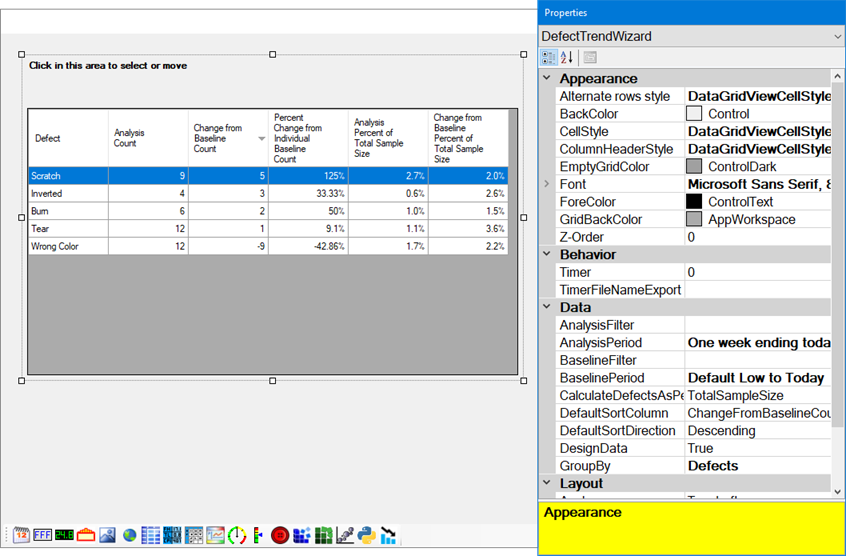
The Defect Trend Wizard control is placed on the dashboard, and the Properties panel displays the properties for this control.

When the dashboard is open in design/edit mode, you can select, move, or resize the Defect Trend Wizard control.
To select a Defect Trend Wizard control that has been added to a dashboard, click the text area at the top of the control. Alternately, you may use the Properties panel to select the Defect Trend Wizard control.

To move the control, use that same text area at the top of the control to click and drag the control to a new location. Alternately, you may use the Properties panel to edit the Location properties of the control.
To resize the control, select the control and then drag the perimeter handles. Alternately, you may use the Properties panel to edit the Size properties of the control.
For instructions on using the Properties panel, see Changing the dashboard and control properties.
GroupBy – determines how rows are divided. If you choose anything except Defect (such as Process, Shift, Machine, etc.), each row will analyze a combination of that item (like "Shift 1" or "Cutting Machine") and a specific defect.
BaselineFilter – For the Baseline data set, this limits the data retrieved for analysis, based on filter criteria you specify.
This is where you can filter for specific Part Numbers and/or Processes, traceability values, or both.
Filtering for desired values can significantly shorten retrieval time.
For more information, see Working with Filters.
AnalysisFilter – For the Analysis data set, this limits the data retrieved for analysis, based on filter criteria you specify.
This is where you can filter for specific Part Numbers and/or Processes, traceability values, or both.
Filtering for desired values can significantly shorten retrieval time.
For more information, see Working with Filters.
BaselinePeriod – For the Baseline data set, this limits the data retrieved for analysis, based on the Date/Time stamps of the data records. Narrowing the date range can significantly shorten retrieval time. For information on choosing date periods, see Setting the Date Periods.
AnalysisPeriod – For the Analysis data set, this limits the data retrieved for analysis, based on the Date/Time stamps of the data records. Narrowing the date range can significantly shorten retrieval time. For information on choosing date periods, see Setting the Date Periods.
CalculateDefectsAsPercentOf – This determines how defect percentages are calculated
DefaultSortColumn – This determines which column is used to initially order the defect rows on this control.
DefaultSortDirection – Determines whether the DefaultSortColumn is sorted in Ascending or Descending order.
For information on other properties for this control, see Common dashboard control properties.
When the Defect Trend Wizard control is displayed, you can:
click a column header to sort the rows based on that column
right-click anywhere on the grid and then chart all of the Baseline data or all of the Analysis data
right-click a row and then chart the Baseline data or Analysis data for only that row
right-click a row and launch the Drill-Down Wizard for the Analysis data for that row
For more options, see Using the right-click menus for dashboard controls and Opening, viewing, and changing dashboard windows.