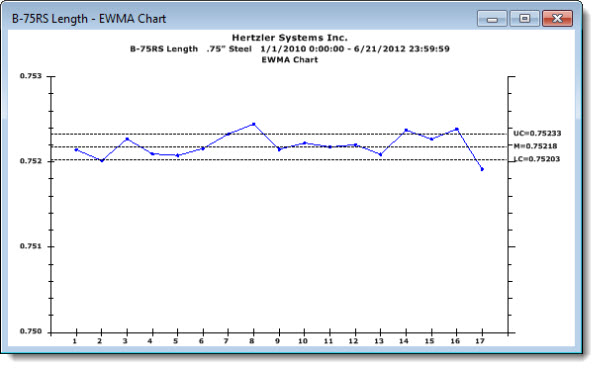
The EWMA (Exponentially Weighted Moving Average) Chart uses a weight value to create a moving average.
|
Contents [Hide] |
An EWMA Chart provides a better representation of batch processes by letting you examine the influence of prior data points on a current sample. It allows for smoothing of data, normalizing the effects than an out-of-control spike will have on a data set.
See Chart Settings options for information on changing the display elements of this chart.
You can use a simple technique called "data brushing" to select any number of consecutive data points on a chart. Then, select from options that allow you to focus on just that data or to exclude it from the retrieval.
Click anywhere on a data point to display its value as shown in Fig. 1.
Click on any limit line to display the value for that limit as shown in Fig. 2.
Fig. 1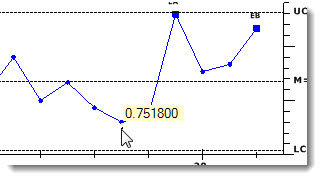 Fig. 2
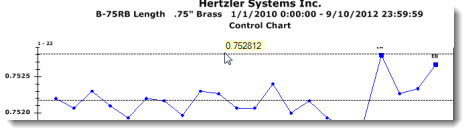
Depending on how your GainSeeker is configured, certain access rights may be required to use this function.
For information on editing data, data notes, and more, see: