You can decide whether to display X-bar and Range charts, only X-bar charts (the default), or only Range charts. If a standard is configured for Moving Range or Sigma charts, that chart will be substituted for the Range chart.
Select the option you want from the Display Charts panel.
GainSeeker SPC vertically aligns subgroup averages from different retrieval groups that share the date/time stamp or traceability information you specify. (When matching the date/time stamps of data records from different retrieval groups, SPC actually matches date/time stamps that are close to each other.
For example, the following chart lines up data points where the Cavity number, Date/Time stamp, and Lot number are identical. It then sorts these points in order by Cavity number.
By default, SPC lines up data points that share the same Date/Time stamp.
In the Match retrieval group records based on list, select the check box of each field you want to use for lining up data points from different retrieval groups. If you clear all the check boxes in this list, the data records from different retrieval groups will be matched by count (first subgroup retrieved for each retrieval group, second subgroup retrieved for each retrieval group, etc.).
The Combined Control Chart will order the data points by the first field selected in the Match retrieval group records based on list. You can modify the order in which these fields are displayed in this list. To move an item up the list, click the row containing the item and then click the up ![]() button. To move an item down the list, click the row containing the item and then click the down
button. To move an item down the list, click the row containing the item and then click the down ![]() button.
button.
The settings in this list are also used by Multiple Data Tables. If you change these setting for a Combined Control Chart, the default settings are also changed for Multiple Data Tables.
You can choose whether to display a line for the data mean on the Combined Control Chart. This line is labeled " M" on the right-hand side of the chart.
When a Combined Control Chart is scaled to the control limits, a single mean line is displayed at the midpoint between the control limits, as in the following example:
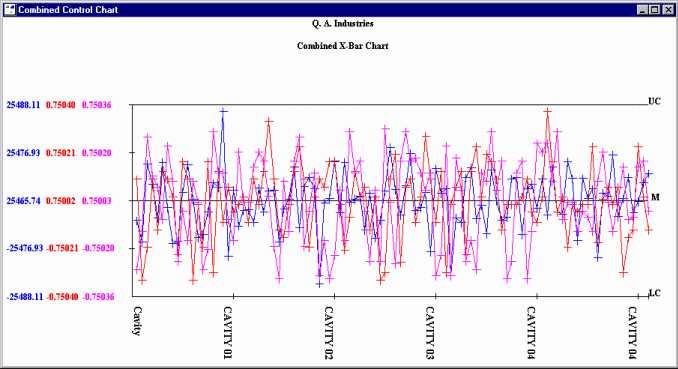
By default, the data mean is not displayed on Combined Control Charts.
To display the mean, select the Display data mean check box. To hide the mean, clear the Display data mean check box.
![]()
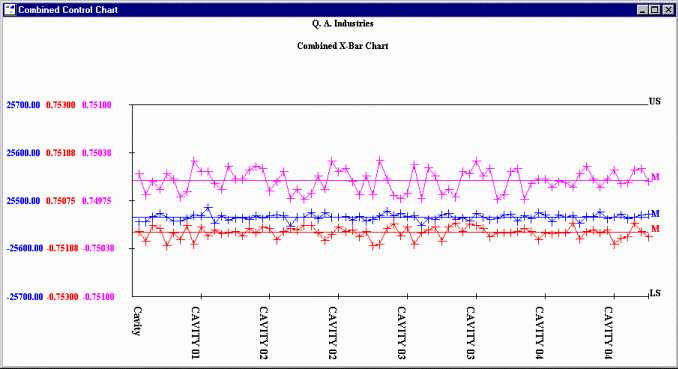
If you have scaled a Combined Control Chart by normalizing it to the specification limits, control limits, gate limits, or individual limits, those labels can be displayed on the right-hand side of the chart. For example, the following chart is normalized to the upper and lower specification limits and displays the labels "US" and " LS" on the right-hand side of the chart.
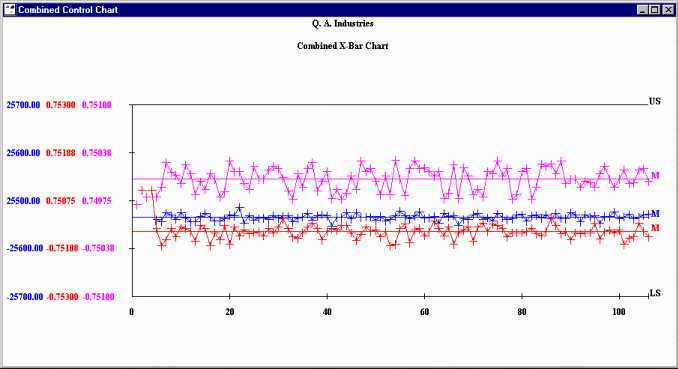
Charts also display labels on the x-axis and on the y-axis.
You may choose whether to display or suppress the limit labels, x-axis labels, and y-axis labels.
Your options include:
Let software decide based on expected readability
When a chart is reduced to a certain size, SPC automatically removes the labels to make the chart easier to read.
Always display labels
Displays the labels on the chart, regardless of chart size.
Never display labels
Does not display the labels on the chart, regardless of chart size.
To save your options as the new defaults, check the "Save as defaults" check box before hitting the OK button.