|
Contents [Hide] |
This setting only applies to pages that are generated when a WebViz user requests a DMS Chart or an SPC Chart. It additionally applies when sending charts to HTML from the GainSeeker Charts module.
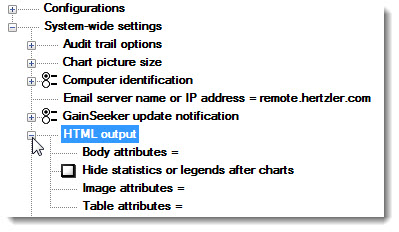
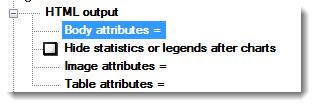
You can use this setting to designate additional HTML attributes that should be added to the <body> tag for the WebViz pages described above. You can find a list of valid HTML attributes for the <body> tag at the w3schools website
To add or change this setting, right-click the Body HTML attributes = node to open the Enter Value dialog. Then, enter the attributes you want to include in the <body> tag for the WebViz pages described above.
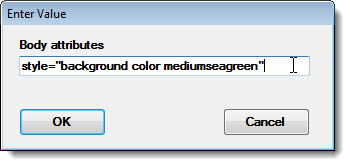
For example, you could enter style="background-color:mediumseagreen" to make this " " the background color any time WebViz generates DMS charts or SPC charts.
This setting only applies to pages that are generated when a WebViz user requests a DMS Chart or an SPC Chart. It additionally applies when sending charts to HTML from the GainSeeker Charts module.
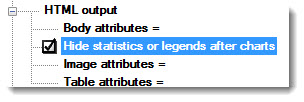
When a WebViz user requests a DMS Chart or an SPC Chart, GainSeeker may automatically display a statistics list or a chart legend beneath the chart (depending on the type of chart the user requested).
For example, an SPC Control Chart is typically followed by a list of common statistics.
To suppress the automatic display of these statistics and/or chart legends, select this checkbox. To automatically display these statistics and/or chart legends, clear this checkbox.
This setting only applies to pages that are generated when a WebViz user requests a DMS Chart or an SPC Chart. It additionally applies when sending charts to HTML from the GainSeeker Charts module.
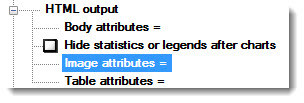
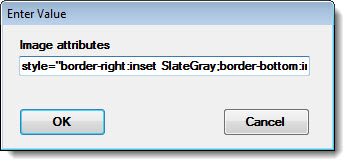
You can use this setting to designate additional HTML attributes that should be added to the <img> tag for the WebViz pages described above. You can find a list of valid HTML attributes for the <img> tag at the w3schools website
For example, you could enter style="border-right:inset SlateGray;border-bottom:inset SlateGray" to add borders to the right and to the bottom of the image any time WebViz generates a chart in the pages described above.
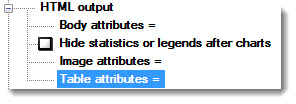
This setting only applies to pages that are generated when a WebViz user requests a DMS Chart or an SPC Chart. It additionally applies when sending charts to HTML from the GainSeeker Charts module.
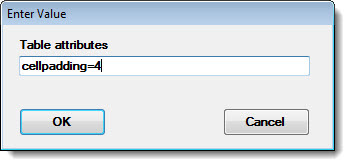
You can use this setting to designate additional HTML attributes that should be added to the <table> tag for the WebViz pages described above. You can find a list of valid HTML attributes for the <table> tag at the w3schools website
For example, you could enter cellpadding=4 to set the amount of empty space between cell borders and cell contents any time WebViz generates a table in the pages described above.