Number of Charts displayed at one time
Your data entry operators can view charts of their historical data as they input new data. You can choose how you want them to view these charts.
To decide how many charts to display on the data entry screen at one time, consider three issues:
How many rows are in your template.
How many charts you want to display at the same time.
How large you want the charts to appear on the screen, so that they are large enough to be legible.
Viewing all the charts for all of the rows at the same time
If the number of charts to be displayed at one time is equal to (or greater than) the number of rows in your template, the operator will see the charts for all of the rows in the template, all at the same time. Please note that if you change your Windows display settings to a higher display resolution, more charts can fit on the screen and still be legible.
Here are some examples:
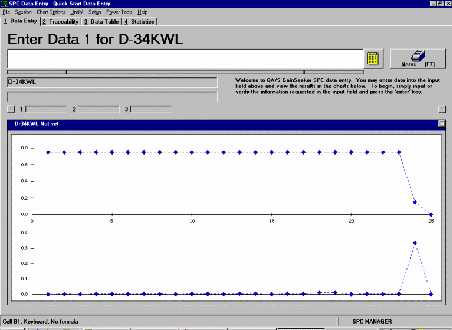
1 across, 1 down for a 1-row template (800x600 resolution)
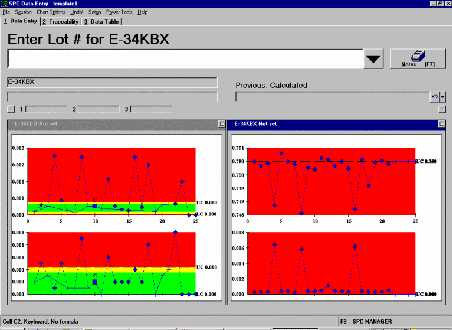
2 across, 1 down for a 2-row template (800x600 resolution)
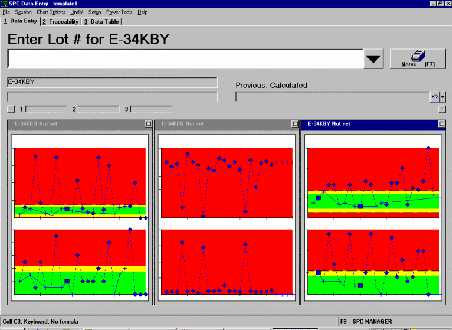
3 across, 1 down for a 3-row template (800x600 resolution)
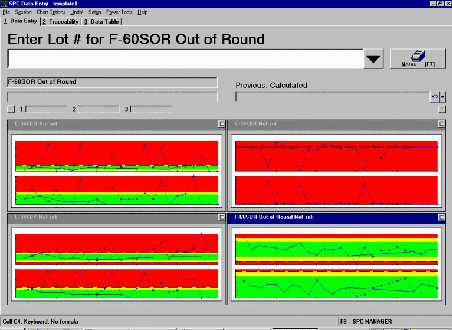
2 across, 2 down for a 4-row template (800x600 resolution)
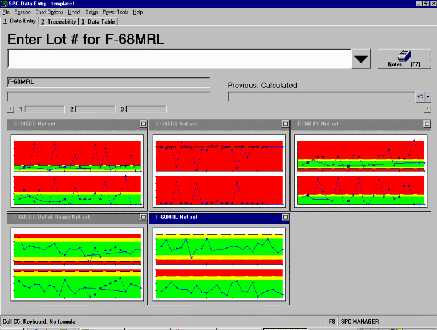
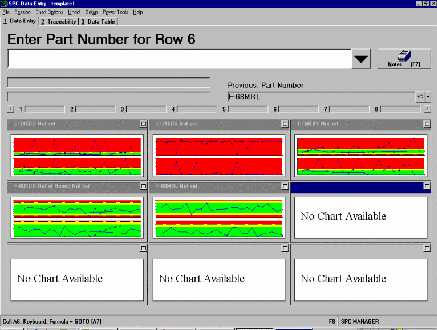
3 across, 2 down for a 5-row or 6-row template (800x600 resolution)
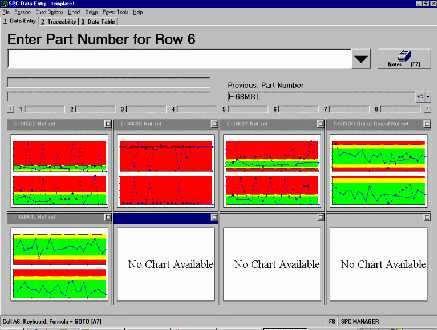
4 across, 2 down for a 7-row or 8-row template (1024x768 resolution)
3 across, 3 down for a 9-row template (1024x768 resolution)
The maximum number of charts across or charts down is 20. The maximum number of charts that can be displayed at the same time (charts across multiplied by charts down) is 99.
1 across, 1 down
2 across, 1 down
3 across, 1 down
2 across, 2 down
3 across, 2 down
4 across, 2 down
3 across, 3 down
Viewing a few of the charts at a time
If your template contains more rows than you can legibly display on the screen at the same time, or if you just want to display the chart for the row on which the operator is entering data, set the number of charts based on what looks good on the screen. Then when your operator enters data for each row, the template will automatically update which charts are displayed.
Automatically updating which rows are charted in Data Entry
This is probably best explained by example.
If your template contains 9 rows, but you prefer to display no more than 3 charts at one time, then you set the chart display to 3 across and 1 down.
During data entry, when your operator is entering data for rows 1, 2 and 3, the charts for rows 1-3 are displayed.
When your operator moves to row 4, the program updates the chart area to display charts for rows 4, 5 and 6.
Again, when your operator moves to row 7, the program updates the chart area to display charts for rows 7, 8 and 9.
And if your operator returns to row 1, the program updates the chart area to display charts for rows 1, 2 and 3.
![]() Note: In the example above, the chart area will change only when the active row changes to 1, 4, or 7. If you use the advanced settings on step 5 to move the operator from row 3 to row 5, without moving first to a cell in row 4, the chart area will not be updated with the charts for rows 4-6. The chart area changes to reflect a different set of charts only when the template moves to specific row numbers – in this case, rows 4, 7 and 9.
Note: In the example above, the chart area will change only when the active row changes to 1, 4, or 7. If you use the advanced settings on step 5 to move the operator from row 3 to row 5, without moving first to a cell in row 4, the chart area will not be updated with the charts for rows 4-6. The chart area changes to reflect a different set of charts only when the template moves to specific row numbers – in this case, rows 4, 7 and 9.
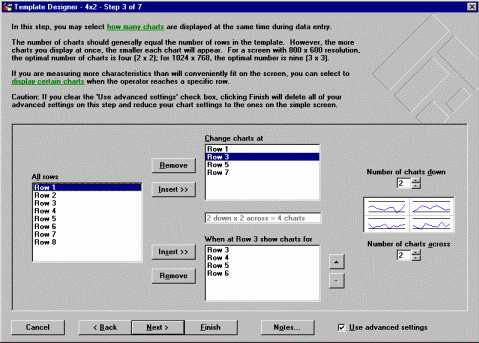
If you want to modify when the charts are updated to reflect different rows, or which rows are displayed when the chart area is updated, select the Use advanced settings check box.
Use the advanced settings to specify when the chart area will be updated, and which charts will be displayed with each update.
To specify the rows where you want to update the chart area of the data entry screen, select one or more rows from All rows, and then click Insert to add the selected rows to the Change charts at list. Please note that the chart area will change to reflect a different set of charts only when the template moves to the rows specified in this list.
![]() Note:To improve template speed, select only a few rows for the Change charts at list. Each time the template moves to a row in this list, it retrieves data, calculates statistics, and generates a chart for each row listed in the When at row # show charts for list.
Note:To improve template speed, select only a few rows for the Change charts at list. Each time the template moves to a row in this list, it retrieves data, calculates statistics, and generates a chart for each row listed in the When at row # show charts for list.
To specify the number of charts to be displayed when you update the chart area of the data entry screen, select one row from the Change charts at list. Then set the Number of charts down and Number of charts across. Repeat this step for each of the rows listed in the Change charts at list.
You may want to set different numbers of charts to be displayed at different rows if you want to chart certain characteristics at the same time. Take the example of a template with 7 rows, when the screen looks best with 4 or fewer charts. In this case, you could change charts at row 1 to display 2 charts across and 2 charts down, and then change charts at row 4 to display 3 charts across and 1 down.
The maximum number of charts across or charts down is 20. The maximum number of charts that can be displayed at the same time (charts across multiplied by charts down) is 99.
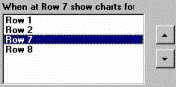
To specify the charts you want to display each time you update the chart area of the data entry screen, select one row from the Change charts at list. Then select one or more rows for which you want to display charts when the template changes to the selected row, and click Insert to add the selected rows to the Whenat row # show charts for list . Repeat this step for each of the rows listed in the Change charts at list.
For example, on an 8-row template that displays charts for 4 rows at a time, you could set it up to update the chart area to display the next 4 rows, every time your template moves to an odd-numbered row. Click here to see the advanced settings screen set up in this way.
You can also use the ![]() and
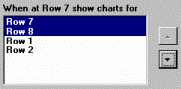
and ![]() buttons on the When at row # show charts for list to change the order of the selected charts on the screen. Select the row that you want to move up or down in the list, and then click one of the arrow buttons to move the row to the correct position.
buttons on the When at row # show charts for list to change the order of the selected charts on the screen. Select the row that you want to move up or down in the list, and then click one of the arrow buttons to move the row to the correct position.
To continue with the example above, if you want to display charts for rows 7, 8, 1 and 2 (in that order) when you change to row 7, you can use the ![]() and
and ![]() buttons to move rows 7 and 8 from this position in the list to this position.
buttons to move rows 7 and 8 from this position in the list to this position.
Sample advanced settings for chart display
Incorrect position
Correct position