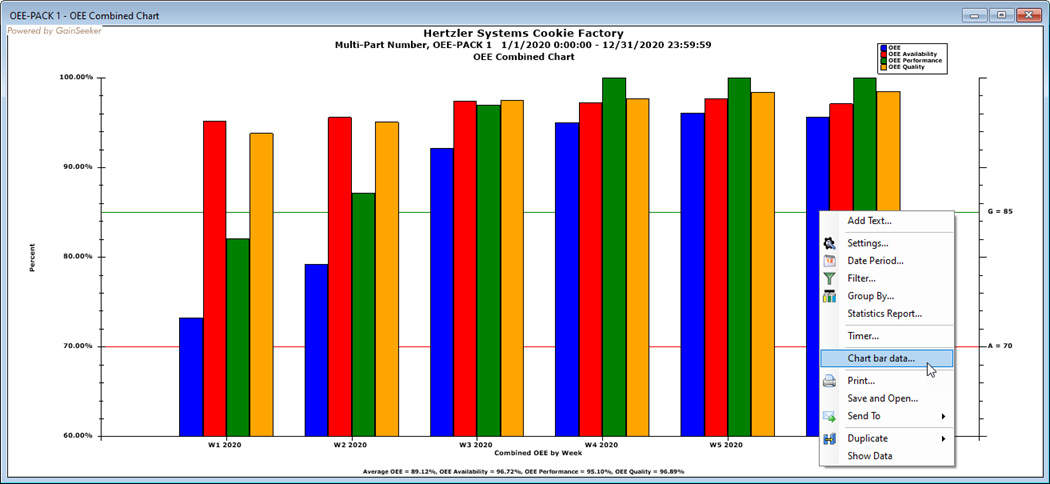
When displaying an OEE Chart, OEE Availability Chart, OEE Performance Chart, OEE Quality Chart, OEE Combined Chart, or OEE Time Chart, you can begin analyzing the OEE defect data for any line chart data point, bar chart bar, or Time Chart cell by right-clicking on that item and then choosing Chart line data, Chart bar data, Chart cell data or Chart row data.

Choosing this option lets you choose a chart type - such as one of the Pareto charts - to analyze the underlying data for this line, bar, or cell.
Beginning with this new chart of underlying data, you can use standard drill-down tools and the Drill-Down Wizard for defect analysis.
 Drilling into OEE defect data is not supported for
OEE charts of external
data..