 Note: Control chart settings and all other settings in the Chart overrides node on the Settings dialog can be saved as a chart skin. See Chart Skins for more information.
You can add a data grid and a scrolling data grid to a DMS Control chart and temporarily override the default setting.
You can assign default settings to charts in the GainSeeker System Administration module. See Chart Defaults settings
Note: Control chart settings and all other settings in the Chart overrides node on the Settings dialog can be saved as a chart skin. See Chart Skins for more information.
|
Contents [Hide] |
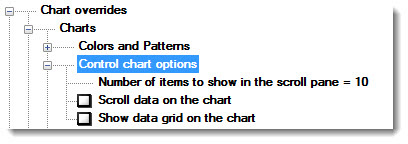
Navigate to Control chart options following this path on the Settings tab:
Chart overrides | Charts | Control chart options
For help with using expandable tree structures like the one featured here, see Navigating Tree Structures
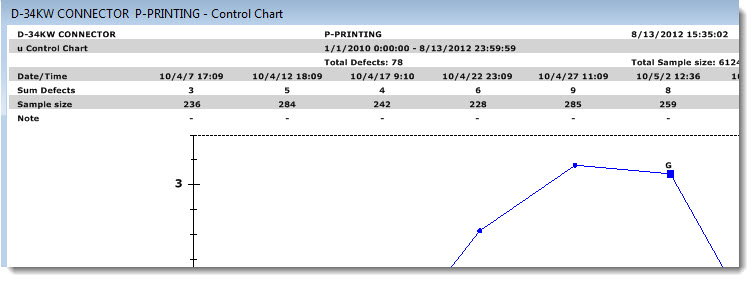
The following chart has been set to display 9 data points at a time (not all are shown in this example) in the charting window as a user scrolls through the data using the scrollbar at chart bottom. The default setting is 10 (the recommended maximum). An optional Control data scrolling grid with user-selected statistics and traceability items has also been added above this chart.
To set this option:
Select the Scroll data on the chart setting option. Then, double-click on Number of items to show in the scroll pane = just above it.
![]()
The Enter Value dialog box opens.
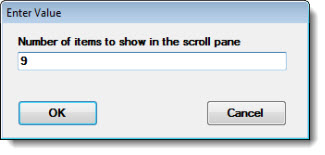
Enter a numeric value in the text box of the Enter Value dialog box that represents the number of data points to display on the chart at one time. (10 or less items to show in the scroll pane is a good number to start with for readability purposes).
The Scroll data on the chart check box must be selected for the following options to properly display:
Number of items to show in the scroll pane = n described immediately above in this topic
or
The Show data grid on the chart check box described immediately below in this topic
Adds a data grid above the chart on the chart window when this setting is selected.
Note: the Scroll data on the chart check box must also be selected for this feature to properly display:![]()
Note: The Show data grid on the chart option displays best when Number of items to show in the scroll pane = n is set to 10 or less data points on a charting window.