Note: Colors and Patterns settings and
all other settings in the Chart overrides
node on the Settings dialog can
be saved as a chart skin. See Chart Skins
for more information.
Note: Colors and Patterns settings and
all other settings in the Chart overrides
node on the Settings dialog can
be saved as a chart skin. See Chart Skins
for more information.Select display colors and patterns for charts and tables.
Note: Colors and Patterns settings and
all other settings in the Chart overrides
node on the Settings dialog can
be saved as a chart skin. See Chart Skins
for more information.
|
Contents [Hide] |
To temporarily override default these settings on charts, navigate to the Colors and Patterns settings on the Settings tab following this path:
Chart overrides | Charts | Colors and Patterns
For help with using expandable tree structures, see Navigating Tree Structures
To set the Colors and Patterns default settings, follow this path on the Configurations tab of the System Administration module:
Configurations | (Configuration Name) | Chart defaults | Shared (DMS and SPC) | Colors and patterns
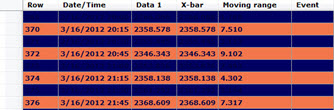
Designate the background colors for even rows on a:
This setting is dependent on the selections made on other settings. For more information, see Alternate row colors
Designate the background colors for odd rows on a:
This setting is dependent on other settings being selected. For more information, see Alternate row colors
Set the color for the bars on charts as in the following example:
See also: Cycle colors in GainSeeker
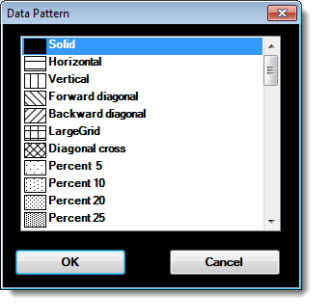
Set the pattern for bars on charts that display bars. The Diagonal cross pattern is selected for this histogram chart example. The bars are set to a blue color using the Bar color = option, and to three-dimensional display using Bars drawn in 3D.
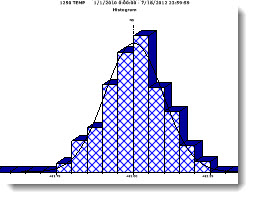
Double-click Bar pattern = to open the Data Pattern dialog. Click a pattern to select it.
When displaying a chart with bars, select this check box to display three-dimensional bars, or clear the check box to display two-dimensional bars.
This setting is ignored for DPU charts with second-level grouping.
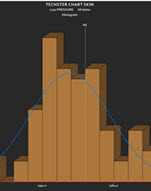
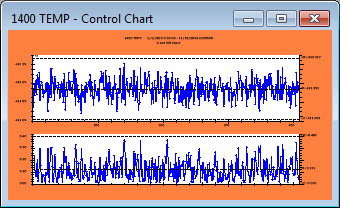
Set the background color of the charting window.
You can also set the color that displays in the plot area of the chart. See Plot Background color setting
In the following example, the Chart background color has been changed to orange.
Add an image to the background of a chart. In addition to making your data analysis more visually engaging, it can serve a practical purpose.
For more information, see Chart background image
Note: System
administrators can find this setting on the Systems
Administration module under Shared
(DMS and SPC) default settings.
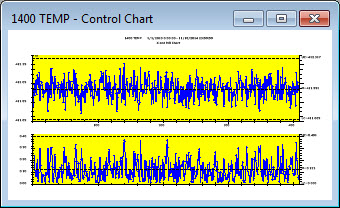
Change the color of the plotting area of a chart.
You can also change the Chart background color (the white background area in the example below)
In the following image, the Plot background color is changed to yellow: