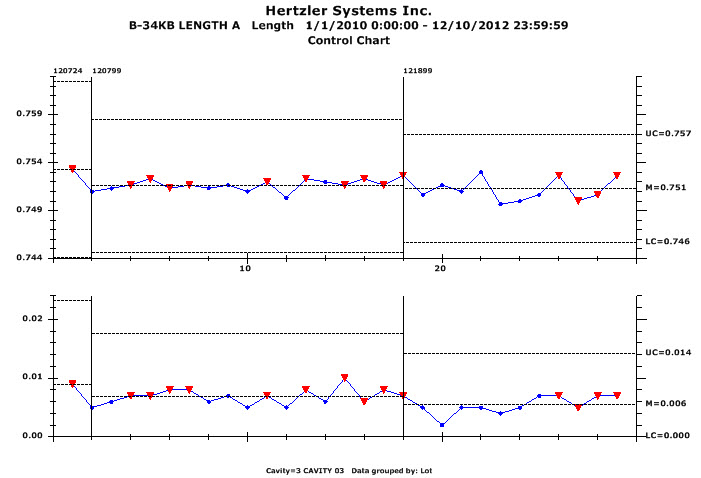
This is an example of a Level 2 analysis using the Variation Wizard for the following chart:
![]()
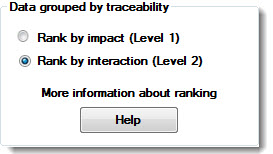
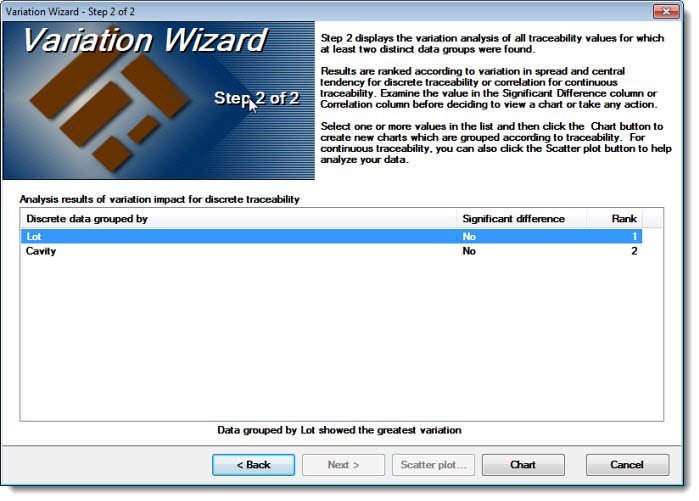
Using the Rank by impact (Level 1) setting option on the Variation Wizard, the traceability values show no significant difference in variation.
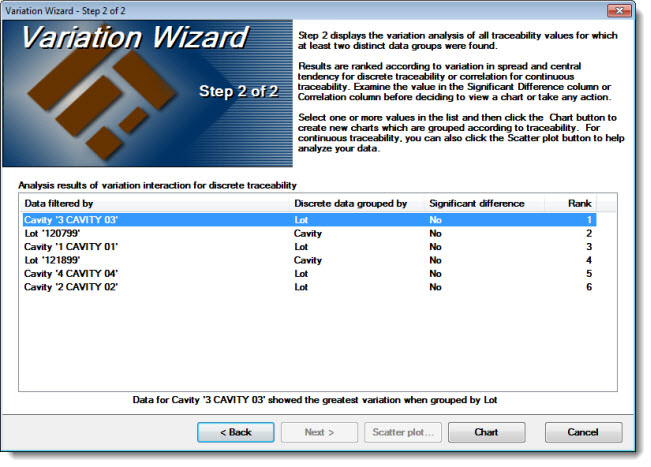
However, you can return to the first page using the <Back button and select the alternate option—Rank by interaction (Level 2). Using the same traceability values, significant differences are detected on the second level page.
The item in the list with the greatest variation was generated from the data set in which only data for Cavity '3 Cavity 03' was grouped by Lot.
In this example, patterns in the data that are not readily apparent at the level one data grouping become obvious when viewed at the second level of data grouping. This chart visually shows why this particular combination of a specific cavity and lot is included at the top of the list: There is less variation for 3 Cavity 03 in Lot 121899 than Lot 120799.