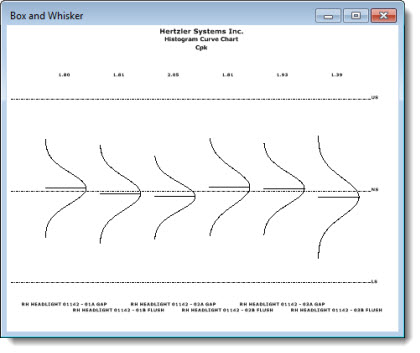
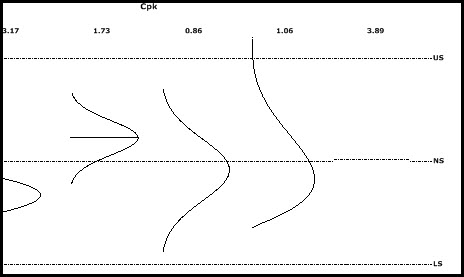
The Process Capability chart helps define the data distribution by illustrating minimum and maximum values in relation to the median. A Histogram Curve Chart is the traditional default chart type that opens in GainSeeker when a new Process Capability chart is created. However, the chart type can be changed.
 Note: A minimum of five data values are needed to display this chart for a data distribution. These can come from: five or more data records with a subgroup size of one; three or more data records with a subgroup size of two; two or more data records with a subgroup size of three or four, or one or more data records with a subgroup size of five or more.
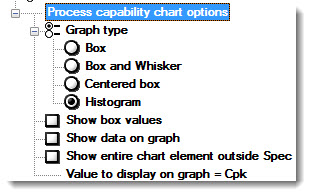
Navigate to the Process capability chart options by following this path on the Settings tab:
Chart overrides | Charts | Multiple Charts | Process capability chart options |
You can also select default chart settings in the GainSeeker System Administration module. See Chart Defaults settings
To change the graph type for a new or an existing chart:
Click Graph type to display the settings. Then, click a graph type to select it.
|
Graph Type |
Description |
Display |
|
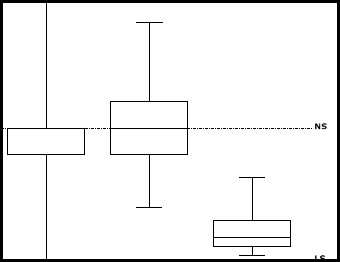
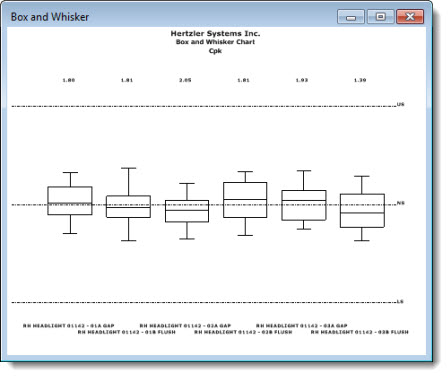
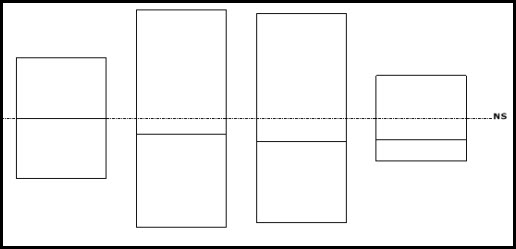
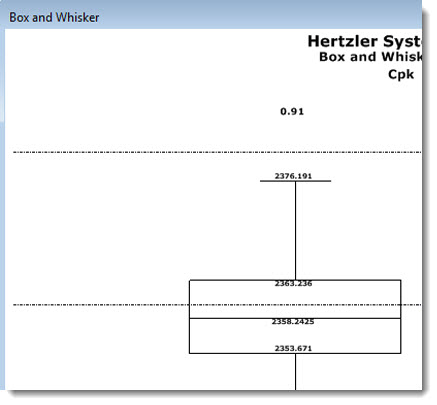
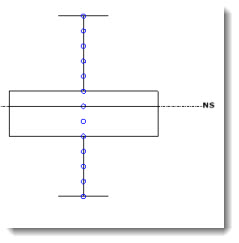
Box and Whisker |
|
|
|
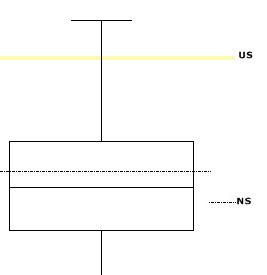
Box chart |
|
|
|
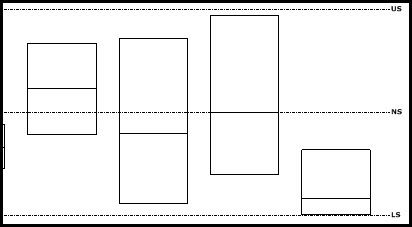
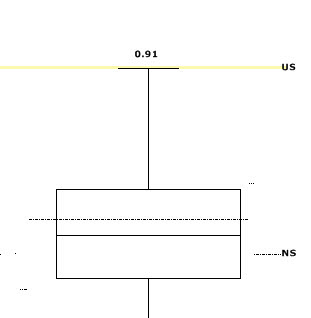
Centered Box chart |
|
 |
|
Histogram |
|
 |
To change the default chart type in the GainSeeker Administration module, see Changing the default chart type
Select the Show box values check box.
Click the checkbox preceding Show data on graph to select it.
Click the checkbox preceding Show entire chart element outside Spec to select it.
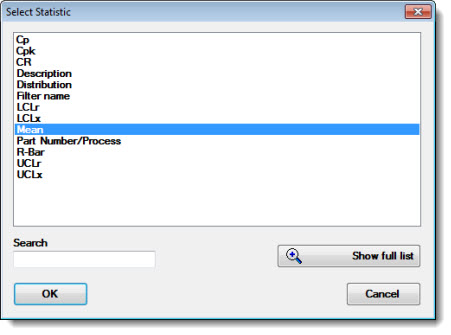
Sets the statistic or value to display on the chart when this option is selected.
The Select Statistic dialog opens.
Click a statistic to select it for the chart. Then, click OK.
You can select the statistics to display under a Process Capability chart.
To select the statistics that display:
Chart overrides | Charts | Default reports | Statistics under multiple capability chart
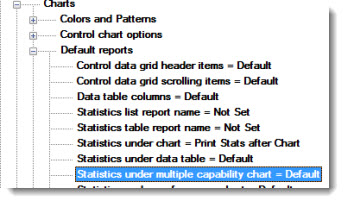
Double-click Statistics under multiple capability chart.
The Statistics under multiple capability chart dialog opens. See Using Select Statistics dialogs
Note: To display statistics under a chart on your screen, the Show statistics list under chart option must be selected on the Settings tab.