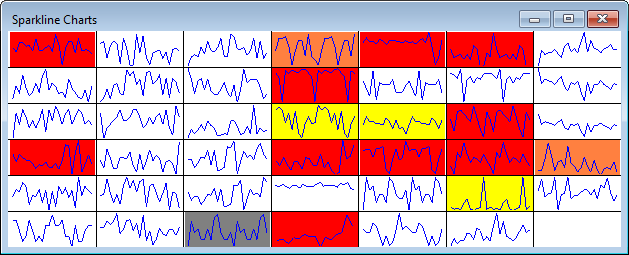
The Sparkline Charts window makes it easy to view the real-time failure status of hundreds of SPC standards at once.
Each sparkline for subgrouped data displays a control X-bar chart, and for individuals data (subgroup size = 1) it displays a control X chart.
|
Contents [Hide] |
One Sparkline Charts window can display individual sparklines for up to 625 retrievals.
To determine the data records that will be retrieved for the Sparkline Charts window:
Use the Part
Number tab to choose
SPC standards.
![]() If you select all
SPC standards, important
considerations apply.
If you select all
SPC standards, important
considerations apply.
Use the Settings tab to choose settings that will apply to each SPC standard you selected:
Any other Retrieval/Configuration settings
Use the Real-time failure background colors settings to indicate the presence of real-time failures on sparkline charts.
On the Settings tab, this is found at Chart overrides | Charts | Sparkline Charts | Real-time failure background colors
This enables or disables the sparkline background colors and determines which data should set the color.
Highest Priority - enables the sparkline background colors. Based on the number of Records to include, the sparkline background is set to the highest priority color of the failures found in all of those records (or white if there were no failures in those records).
Most Recent - enables the sparkline background colors. Based on the number of Records to include, the sparkline background is set to highest priority color of the most recent record with failures (or white if there were no failures in those records).
Off - the sparkline background colors are not displayed.
This setting only applies when the Background colors mode (above) is set to Highest Priority or Most Recent.
To display only the sparklines with real-time failures, select this check box. This is useful for viewing and managing real-time failure incidents.
To display all sparklines regardless of real-time failures, clear this check box. With this option, you can quickly see the current status of all the sparklines.
This sets how many of the most recent data records should be checked for real-time failures to determine which color will be displayed on the sparkline background.
To check all records on the sparkline, set this to 0.
Real-time failure colors are defined in the System Administration module for the current configuration.
This affects the limit lines and scaling on sparkline charts.
On the Settings tab, this is found at Chart overrides | Charts | Sparkline Charts .
For sparklines that are drawn without any limit lines and are simply scaled to the minimum and maximum data points, clear this check box.
For sparklines that draw the Control chart limits (including their Line settings) and are scaled to accommodate these limits and SPC Standard scaling, select this check box.
You can remove the grid lines that separate one sparkline from the next by clearing this check box.
Individual retrievals are added to this grid as columns from top to bottom and from left to right.
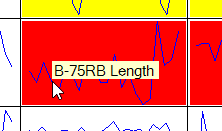
You can click any sparkline to view its part number as a tool tip.
You can right-click any sparkline and choose Chart sparkline data to analyze its data in an individual chart.
When the Sparkline Charts window is displayed, you can use many of the tools that are available for other Summary Charts, such as:
Sending the chart to the Windows clipboard, another program, an e-mail, or a file