 Note: Settings for titles and all other settings located in the Chart overrides node of the Settings dialog can be saved as a chart skin that you can apply to any charts. For more information, see Chart Skins
Use the Define Chart Title dialog to set the text and font for a title line on a DMS or SPC chart or SPC Data Grid.
Note: Settings for titles and all other settings located in the Chart overrides node of the Settings dialog can be saved as a chart skin that you can apply to any charts. For more information, see Chart Skins
On the Settings tab, navigate to the Define Chart Title dialog by following this path:
Chart overrides | Labels and Titles | Chart titles
Then, right-click on the Print title / company name = , Title 2 = , or Title 3 = option to open the Define Chart Title dialog.
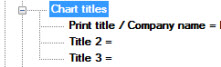
Alternately, when a chart window is active, you can click the Chart Titles button on the GainSeeker Charts toolbar to edit the Print title, Title 2, or Title 3.
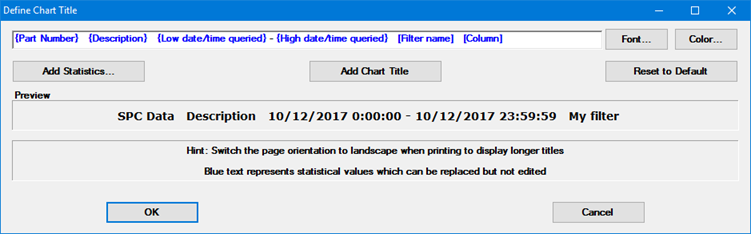
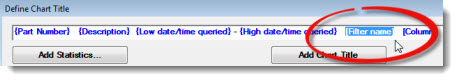
The Print title is the top line of the chart title. You can manually edit the text you want to display on this line.
Title 2 and Title 3 are the middle and bottom lines of the chart title. They can include any combination of plain text, statistics, and the chart type name.
To change the font and font size for the current chart title, click the Font button.
To change the text color of the current chart title, click the Color button.
Changing the font and color on this window will also change the equivalent Settings tree options for Chart overrides | Fonts | Chart fonts | Title 1 (or Title 2, or Title 3).
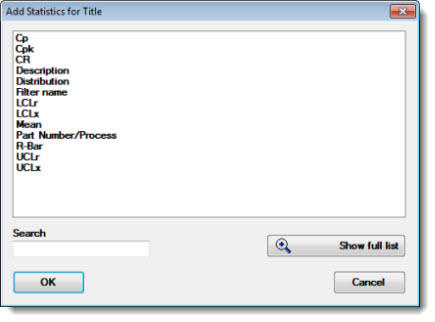
Click Add Statistics... on the Define Chart Title dialog. (This option is not available when editing the Print title.)
The Add Statistics for Title dialog opens. See Using the Add Statistics for Title dialog.
Click OK on the Add Statistics for Title dialog after selecting statistics for the chart title.
The Define Chart Title dialog displays the selected statistics in brackets in the text field. (Use the Preview field to view how your title will display on the chart.)
Click OK on the Define Chart Title dialog when you are finished adding statistics, a chart title, or any user-added text.
Using the context menu, you can choose how each statistic will display on the chart.
Click a statistic label in the text field to select it. Then, right-click on the selected statistic.
A context menu opens for the selected statistic label with three display format options:
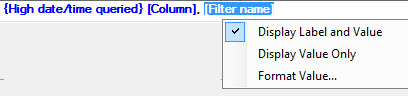
Click Display Label and Value in the context menu to display the statistic label and the value for that statistic in the title (for example, Cpk: 2.05).
Click Display Value Only in the context menu if you want the statistic value displayed in the title without the label for that statistic (for example, 2.05).
Click Format Value... to include a numeric or date/time format to the chart title. For more information, see Numeric formats and Date/Time formats
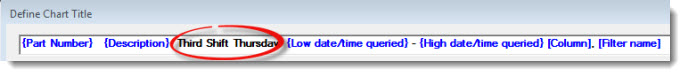
Additional text can be added to a title by entering text in the field, but only outside the statistic label brackets { }. In this example, the user typed Third Shift Thursday between the {Description} and the {Low date/time queried} statistic labels.
A selected statistic label can be deleted or replaced with another statistic, but not edited within the brackets.
To delete a statistic label from the text field, select it and then delete it:
To add a chart type title to the title line:
Click a blank space in the text field where you want the chart type ("Control chart," for example) to display.
Click the Add Chart Title button on the dialog. (This option is not available when editing the Print title.)

By typing any part of a statistic name in the Search field, you can restrict the list so it will display close possible matches.
Commonly used statistics are shown in the short list of available statistics. The following example shows SPC statistics. For a DMS chart, DMS statistics will display. To view the extended list of available statistics, click the Show full list button.
|
To: |
Do this on the Add Statistics for Title dialog box |
|
Select one statistic— |
Click a label in the list |
|
Select several statistics listed in sequence— |
All statistics between the first and last label will be selected. OR
|
|
Select several statistics not listed in succession— |
|