If you have rights to do so, you can edit an SPC data record from a Control Chart or Data Table.
|
Contents [Hide] |
To edit the data from a Control Chart, right-click the data point you want to edit, and then click Edit Data or Edit Note.
To edit the data from a Data Table, you can:
double-click the row you want to edit.
right-click the row you want to edit, and then click Edit Data or Edit Note.
click on the row you want to edit, then click the Options menu and select Edit Data or Edit Note.
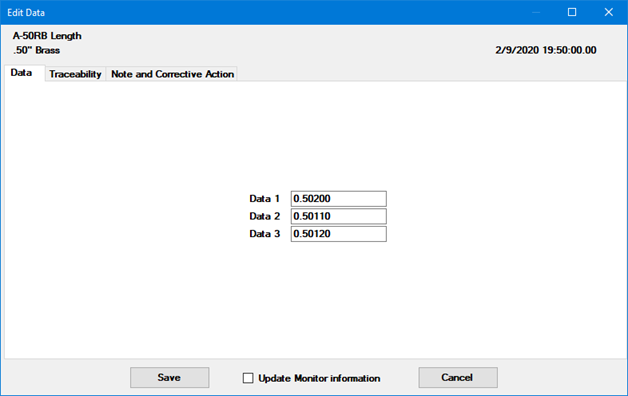
All of these methods display the Edit Data window:

On the Data tab, edit any of the measurement values.
For a missing measurement, you may enter an asterisk ( * ) in place of a missing measurement. For more information, see Entering an incomplete subgroup.
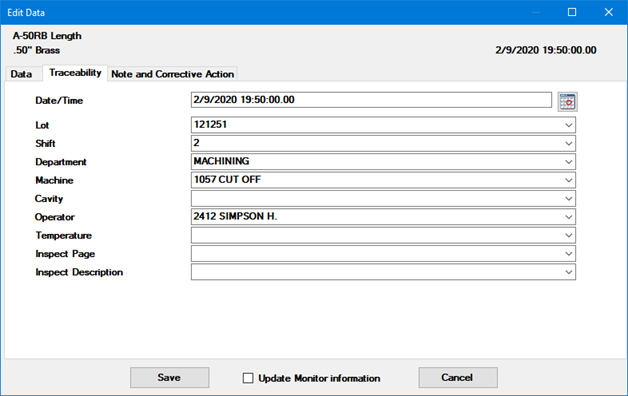
On the Traceability tab, edit any of the traceability values by typing a value or by choosing a value from the predefined list.
You can also use this tab to change the Date/Time stamp.

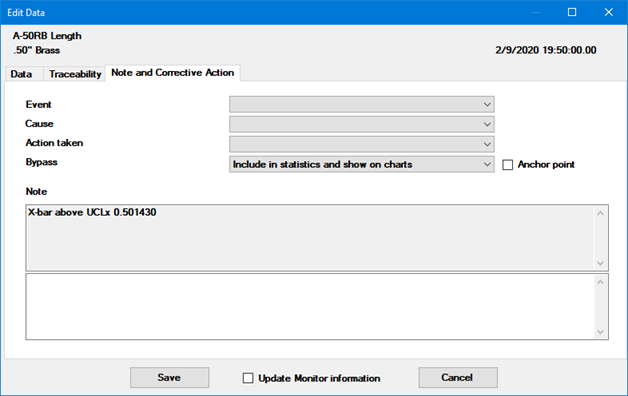
All of these values can be changed on the Note and Corrective Action tab:

Depending how GainSeeker is configured, you may be prevented from changing existing notes like the example above (the default behavior). In this case, the gray area displays any existing notes, and you can enter additional notes in the white area. (See also: Note Manager)
Otherwise, the Note area displays all notes in one white area where you can add, change, and delete notes for this record.
You can create a clickable link to a file or web address by entering file://address or http://address . (An inspection performs this step automatically when it submits data with photos or videos.)
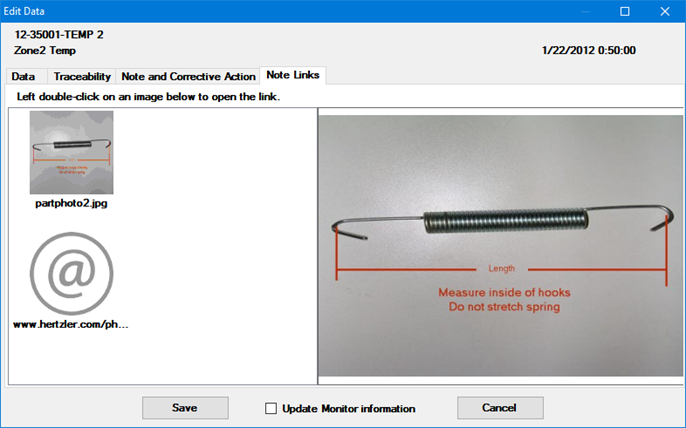
After clicking the Save button to save your changes, editing this data record again will display a new Note Links tab with a thumbnail image for each file or web address in the note. You can double-click the thumbnail image to open that file or web address in the program that Windows associates with that file type.

Both keywords (file: and http:) work the same way, although it is typical to use file: when linking to a file on your network and http: when linking to a web address.
The first space or end-of-line character that is found after the file: or http: keyword is considered to be the end of the address.
If there is a space in the address (for example, in the name of a file or folder), put quotation marks around the address.
Do not put a space between file: and the address, or between http: and the address.
You can include multiple file: and/or http: references in a note.
Valid links can be formatted like these examples:
Typical: |
Also works: |
file:\\servermfg03\controlplans\414403.doc |
http:\\servermfg03\controlplans\414403.doc |
file:"\\servermfg03\control plans\414403.doc" |
http:"\\servermfg03\control plans\414403.doc" |
file:F:\Quality\pix\dhc41223.jpg |
http:F:\Quality\pix\dhc41223.jpg |
file:"F:\Quality\pix\sample 3102.gif" |
http:"F:\Quality\pix\sample 3102.gif" |
http://www.google.com |
file://www.google.com |
http:www.google.com |
file:www.google.com |
http:https://mail.google.com |
file:https://mail.google.com |
You can quickly designate an Event, Cause, and/or Action Taken for a data record by selecting a value from the predefined list.
The vast majority of your data should represent the common cause variation in your process and use the default Bypass setting Include in statistics and show on charts.
If a particular data record does not truly represent the process because of an assignable cause of variation, you may want to exclude this subgroup from statistical calculations or from all data retrievals.
To display the subgroup on charts, reports, and data lists but exclude it from most statistical calculations for values like Control Limits and Cpk, change the Bypass setting to Remove from statistics but show on charts.
To exclude the subgroup from all data retrievals, change the Bypass setting to Remove from statistics and hide from charts. If you choose this option, you can only retrieve this subgroup by using a filter to find subgroups where Bypass is True.
If this data record should be marked as the first in a new series, such as a new job run, you can mark the subgroup as an Anchor point.
There are two ways that an Anchor point can affect control charts:
By default, a vertical line is drawn through each Anchor point on the chart. You can use the chart setting for Divider and gridlines to suppress this behavior.
By default, each Anchor point on the chart begins a new Data Group with control limits calculated separately from the previous Data Group. You can use the chart setting for Group data on control, CuSum and Performance charts to change this behavior.
If this data record has already been modified, an Audit Trail tab will also be displayed. It is formatted like the full Audit Trail utility and displays the old and new value for each change.
This tab will not be displayed to users without rights to "View Audit Trail Tab - Data".
To update the corresponding record in the legacy SPC Database Monitor module, select the Update Monitor information checkbox. See Write to monitor files for information on configuring a standard to write to the Monitor.