GainSeeker Defect Management System (DMS) charts can help you identify and eliminate the root causes of errors and defects in your business. Defect management techniques work in almost any environment where quality is counted, but not measured. Managing defects helps reduce cycle time and costs associated with scrap and rework.
GainSeeker uses your OEE data to calculate Availability, Performance, and Quality, and then uses these three metrics to calculate OEE.
|
Contents [Hide] |
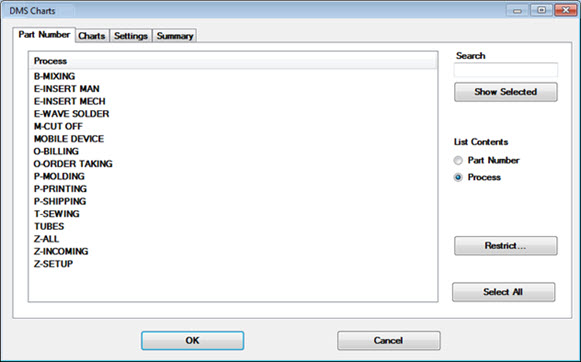
To create charts, begin by accessing the DMS Charts dialog (shown above ) from the GainSeeker Charts module by using either:
The DMS/OEE Charts dialog can be accessed from the GainSeeker Charts module.
A quick way to access the GainSeeker Charts module is to open the LaunchPad.
Then, click the GainSeeker Charts button.
The GainSeeker Charts window opens:
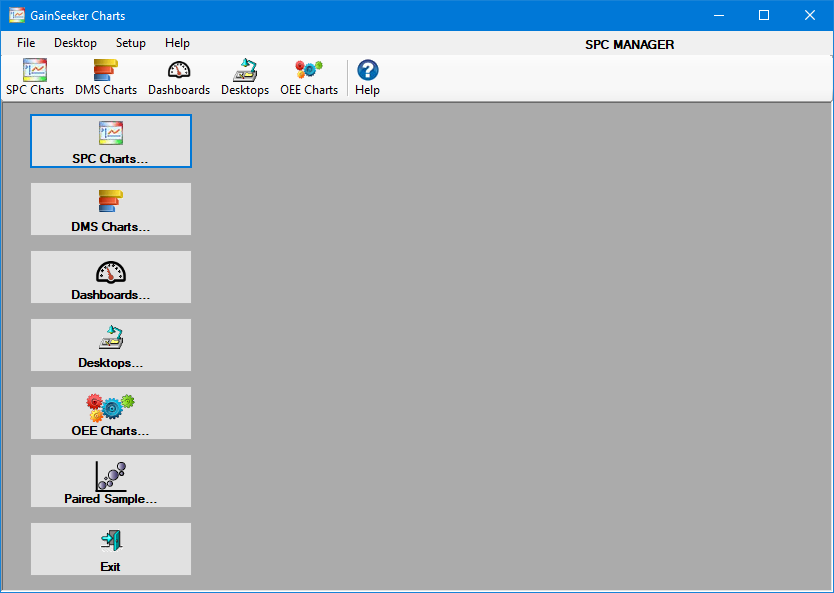
Access the DMS/OEE Charts dialog from the GainSeeker Charts window by using either:
Click the DMS Charts... or OEE Charts... quick-start button on the GainSeeker Charts window.
The DMS/OEE Charts dialog opens. See Using the DMS/OEE Charts dialog
|
Click the File menu on the GainSeeker Charts window.
Click the DMS Charts... or OEE Charts... option from the menu that displays.
The DMS/OEE Charts dialog opens. See Using the DMS/OEE Charts dialog
Click the DMS Charts button or the OEE Charts button on the GainSeeker Charts toolbar.


The DMS/OEE Charts dialog opens. See Using the DMS/OEE Charts dialog