A dashboard is a visual display of the most important information needed to achieve one or more objectives; consolidated and arranged on a single screen so the information can be monitored at a glance.—Stephen Few, consultant and author of books on practical data visualization techniques for analyzing and presenting quantitative information
|
Contents [Hide] |
The GainSeeker Charts dashboard design window features tools for creating dashboards from the simple to the complex, which display pertinent data at a glance and with a click.
This interactive dashboard example features the manufacturing floor of a fictitious cookie company. With a single click, the dashboard controls on this dashboard window allow quick access to data entry, charts, desktops, and other information. Dashboard controls can be set to refresh to display the latest data at an interval you set or they can refresh along with the dashboard.
The dashboard example above is comprised of:
An image displayed on the dashboard window background.
You can create your own background image similar to this by using a diagramming program such as Microsoft® Visio. A copy of the image used in this example (to which you can add your own dashboard controls) is available if you installed the GainSeeker Tour Foods data. You can also set the background as a photo of your plant floor layout, a drawing of a part, or a photo of your process. See Setting an image to display below in this topic.
Nine dashboard controls; three designated to each standard on a manufacturing line.
Two Button dashboard controls for each of the three manufacturing lines. See Adding the Button controls to this dashboard
One DateTime control for each of the three manufacturing lines. See Adding the DateTime controls to this dashboard
There are more than a dozen dashboard control types, many of which also offer interactive features. For more information, see Adding dashboard controls to the dashboard window
To select a background image for a dashboard:
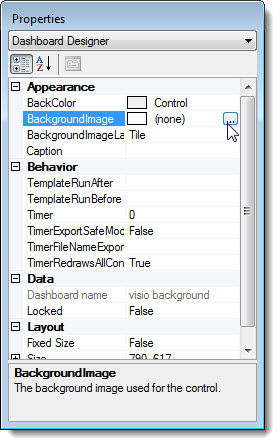
With a dashboard open in design/edit mode, click the Backgroundimage property in the Appearance category on the Properties dialog box.
Then, click the ellipsis button to display the Open file dialog box. Select a saved image to add to the dashboard background.
The following is an overview about adding the Button controls to the dashboard. For more detailed information about this control, see Button dashboard control
To add the Enter Data or View Charts button controls:
Add a Button control to the dashboard window that is in design/edit mode. See Add a Button control to the dashboard window
On the Dashboard Control Retrieval dialog box that opens, click the No Retrieval button.
On the Set Label Text dialog box that opens, enter the caption "Enter Data" (or "View Charts" for the other button) to display as a label on the Button control.
The Button opens on the dashboard window. Now, you can change properties for the Button.
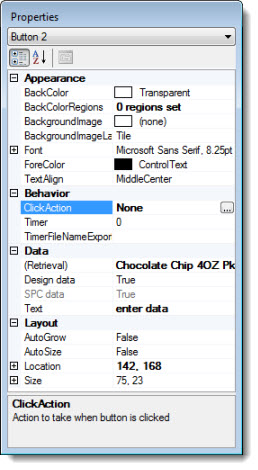
Click the new Button control to display the properties for it on the Properties dialog box (refer to diagram below).
Click the ClickAction property in the Behavior category, and then click the ellipsis button:
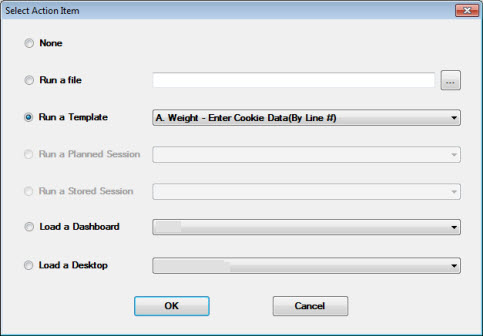
The Select Action Items dialog opens. Use this dialog box to select the click-action item for the control. For more information, see Selecting the ClickAction property
The "Enter Data" Button click-action function for this dashboard example: Runs a data entry template, a planned session, or a stored session for that manufacturing line.
The "View Charts" Button click-action function for this dashboard example: Opens a saved desktop that displays a chart for the retrieval. See Storing desktops for more information
Repeat steps 1–5 above for manufacturing lines #2 and #3 on the dashboard.
The following is an overview about adding the DateTime controls to the dashboard. For more detailed information about this control, see DateTime dashboard control
To add the DateTime control to the dashboard for a standard:
Add a DateTime control to the dashboard window that is in design/edit mode. See Adding a DateTime control to a dashboard window
On the DateTime Display Options dialog box that opens, select a time display option. For this dashboard example, the DateTime controls are set to reflect the Last Data (date and time of most recent data) based on time elapsed since last check. For more information on this and other options, see Selecting a DateTime Display option
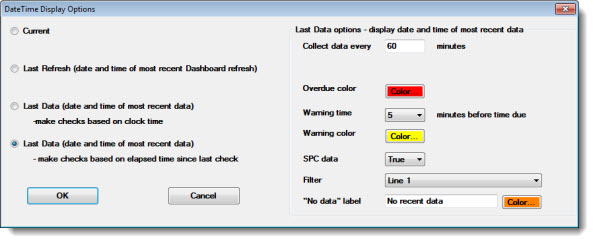
Optionally select the conditions under which you want exception colors to display on the button. For this dashboard example, the button will turn red when a scheduled data collection is overdue; yellow, five minutes before a scheduled collection; and orange, when there is no recent data. See Displaying exception colors on the control
Select a Filter that limits the data to only the data you want to track, such as the manufacturing line in this example. See Working with Filters and Using Quick Filters. for information on selecting filter conditions
Repeat steps 1–3 above for each manufacturing line.
You can find information about different ways that GainSeeker customers use dashboards by reading "The Data Heads" blog at the Hertzler Systems Inc. website.