Item
Explanation
Sparkline
Chart
Chart (2x height)
Chart (4x height)
Trend
Trend (2x height)
Trend (4x height)
Charts of the data retrieved for each row of the dashboard.
Trend charts display the mean trend line.
Chart scaling:
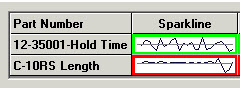
The Sparkline, Trend, Trend (2x height), and Trend (4x height) are scaled to the minimum and maximum data points, and no limits (for example, Control or Gate) are displayed.
The Chart, Chart (2x height), and Chart (4x height) are scaled according to data points or limits as follows:
Choosing
the limits:
If the chart
defaults for the current configuration are set to display
Gate limits, but not Control limits, these charts use the Gate
limits and/or data to scale the chart. Otherwise, these charts
use Control limits and/or data to scale the chart.
Scaling
the top of the chart:
The top of the chart is scaled to the maximum data point or the
upper limit, whichever is higher. (When using Gate limits, and
the upper Gate limit is not set for this standard or process specification,
the top of the chart is scaled to the maximum data point.)
The upper limit only displays on the chart when the maximum data
point falls above this limit.
Scaling
the bottom of the chart:
The bottom of the chart is scaled to the minimum data point or
the lower limit, whichever is lower. When using Gate limits, and
the lower Gate limit is not set for this standard or process specification,
the bottom of the chart is scaled to the minimum data point.)
The lower limit is only displayed on the chart when the minimum
data point falls below this limit.
Chart height:
The Sparkline and Chart are sized to the same height as the font used for the dashboard.
The Chart (2x height) and Trend (2x height) are sized to two times the height of the font used for the dashboard.
The Chart (4x height) and Trend (4x height) are sized to four times the height of the font used for the dashboard.
Chart width:
The chart width is automatically sized to six times the height of the chart.
The data mean is displayed on all charts.
You cannot change the colors or line types used to display the data or limits.
 Note: When sending a graphical
dashboard to any destination except Microsoft Word or a RTF file,
GainSeeker takes a picture of the portion of the dashboard window
that is visible on your monitor.
Note: When sending a graphical
dashboard to any destination except Microsoft Word or a RTF file,
GainSeeker takes a picture of the portion of the dashboard window
that is visible on your monitor.