A columnar report allows you to report information for individual data subgroups on multiple standards, sorting that information by traceability field or date and time stamp.
Example columnar report.
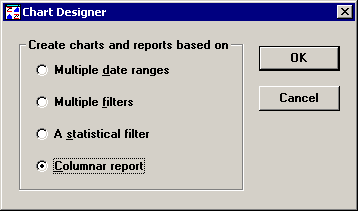
From the Chart Designer, click Columnar report, and then click OK.

Select the standards you want to report, and then click Next.
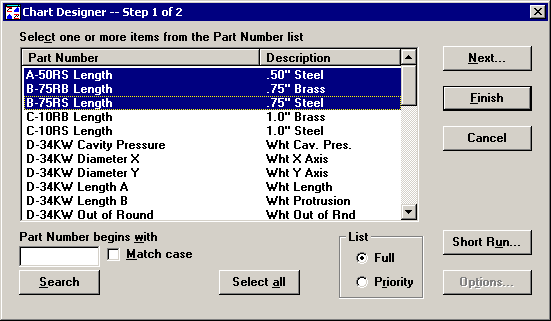
Tip: You should limit the number of standard you select to slightly less than the number of columns you can fit on one page of a report, as in the example above.
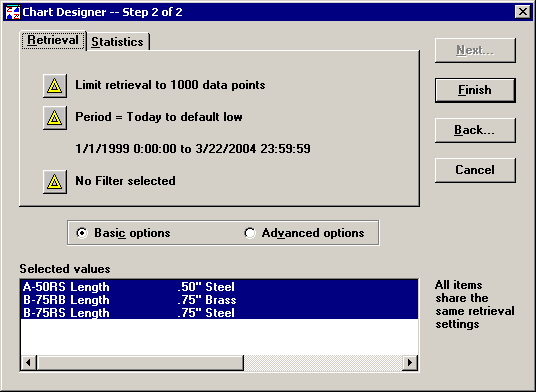
Set any retrieval and statistical options you want, and then click Finish.
Select a report format to display your data, and then click OK.
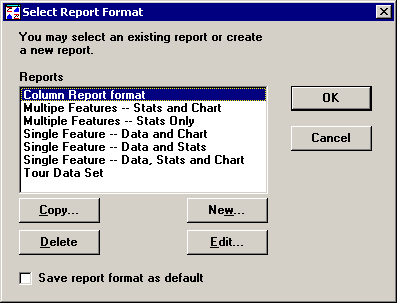
The first time you create a columnar report, you should create a new report format for this special kind of report. Selecting a report format not specially created for columnar reports will probably produce unexpected results.
Click New to create a new report.

Type a new name in the Report Name box.
On the Detail tab, first select the traceability field by which the data records will be sorted on the report. Or to display Date/Time in the first column, first select Date/Time, and then select the traceability field by which the data records will be sorted. The data records will be sorted by the first traceability field on the Selected detail columns list, with an automatic secondary sort by Date/Time stamp – even if the Date/Time column is not displayed.
To sort the data records only by Date/Time, select only Date/Time, and then skip to step 5, below. Do not select any traceability fields.
In the example below, the data records are sorted by Operator number.
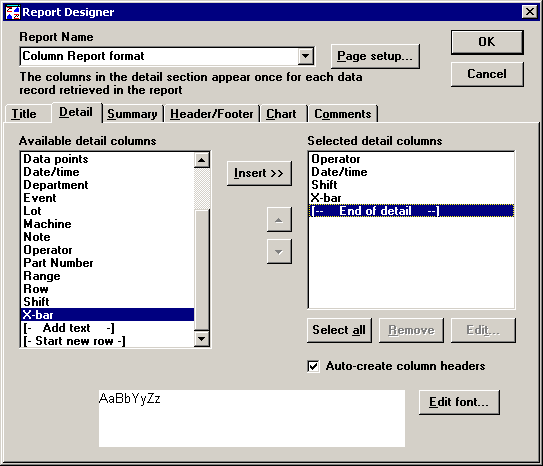
Next, select any other traceability fields or Date/Time. These columns will also be displayed on the report, but they will not affect the sort order of the data records displayed on the report. In the example above, the Date/Time and Shift will also be displayed for each data record.
Finally, select the type of data value to display for each data record: X-Bar, Data points, or Range / Sigma / Moving Range.
The "Data points" option is recommended for standards with a subgroup size of 1. If you select Data points but generate a columnar report for a standard with a sample size of 2 or greater, the X-bar value will be displayed for that standard instead of an individual measurement.
In the example above, the X-bar for each data record will be displayed.
On the Summary tab, first select the column headings you want to use for each standard listed on the report. In the example below, the Part Number and the Description will be displayed at the top of the column representing each unique standard.
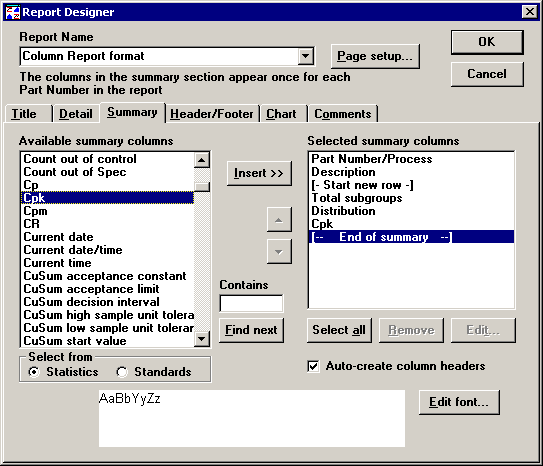
Next, insert a [- Start new row -] column below the column headings you just selected.
Finally, select any other statistics or values you want to display at the bottom of the report for each standard. In the example above, Distribution and Cpk will be listed for each standard at the bottom of the report.
Set any other report settings you want, and then click OK.
|
|
Tip: To fit the maximum number of columns on a page, you may want to click Page setup and set the Orientation to Landscape.
It is important to understand how a columnar report displays your data.
The value in the first traceability column of the report applies to all the data values displayed on that row, regardless of the standard.
For each unique value listed in the first traceability column, the data values listed for each standard are sorted in order by date/time stamp. In the sample report below, all the records for operator 2114 Jordan, M. are displayed in order by date/time stamp.
The date/time stamp and any other traceability (except for the first traceability column) displayed on the report is only taken from the first (left-most) standard that contains data for that row. This means that on a row containing data for the first, second and third standards, the data from the second and third standards may not actually come from the date/time stamp and other traceability values listed on that row (except for the first traceability field used to sort the records).