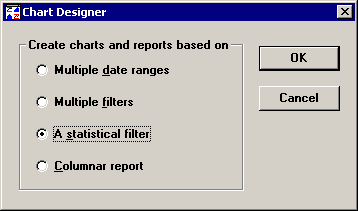
Click A statistical filter. Click OK.

When using a Statistical Filter, it is important to know that this filter applies to your entire database. To avoid selecting all part numbers from your data base (and starting a search that could take many hours to execute), be sure to apply a filter to your part numbers in the basic retrieval options. You will find this in the “Chart Designer Step 3 of 3” dialog.
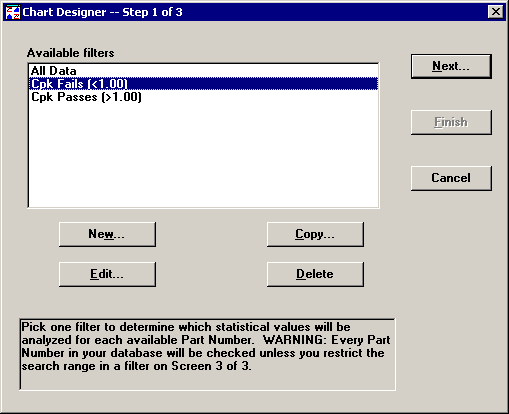
Highlight the statistical filter you want to apply.

If you want to use an existing filter, but you would like to make some changes to it, highlight the filter and click Copy. Using this option allows you to keep the existing filter while making another similar filter. You may want to do this to save time, especially if you want to change only a few items on the existing filter. You probably will want to rename the copied filter. Otherwise, the program adds the word “copy” to the existing file name.
If you want to delete a filter, highlight the filter and click Delete.
To select the charts or reports you want to generate, click Next. Your next dialog will show only the charts or reports you can select. Since the statistical filter applies to all the part numbers in your database, you will not need to select any part numbers.
To end the Chart Designer session, click Cancel.
To generate the charts or reports now, click Finish.
Creating a new statistical filter
Click New.
Editing a statistical filter
Highlight the filter you want to edit and click on the Edit button.