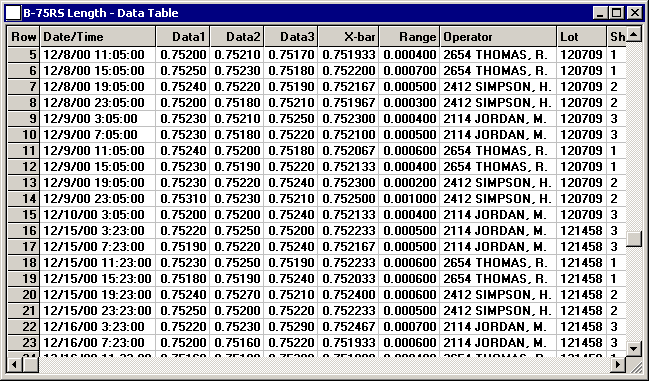
A Data Table allows you to see your data in table format instead of in bar or line charts. It provides a comprehensive, compact display of your data.

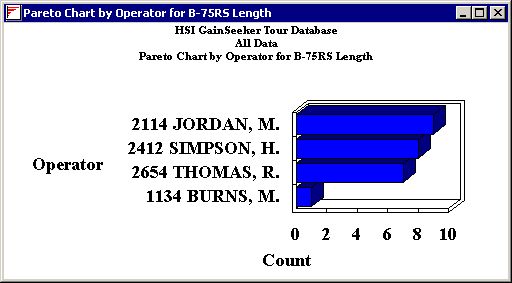
To see how your data points are distributed among various traceability categories, you can draw Pareto charts of the data in your Data Table. The Pareto chart counts the number of data points containing each traceability value and then sorts those traceability values in order by the number of associated data points.
