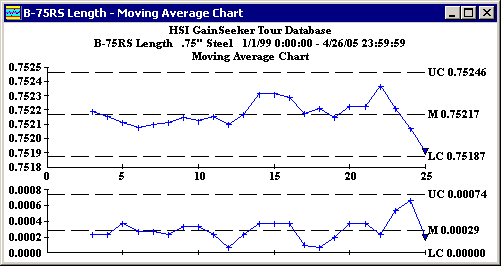
This chart gives a better representation of batch processes because it lets you examine the influence of prior data points on a current sample. It allows you to smooth data, normalizing the effects that an out-of-control spike will have on a data set.
