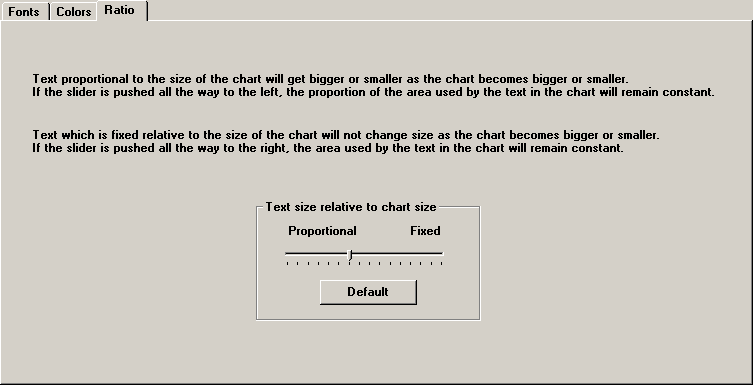
To select how text size changes when you increase or decrease the size of your chart on the screen, click the Ratio tab.

Since the ‘best’ size for text on your chart will depend on your monitor size, the size of charts you commonly view, and personal preference, this setting allows you to control how much the text changes as the chart window becomes bigger or smaller.
By choosing font sizes on the Fonts tab and setting the slider on the Ratio tab, you should be able to draw charts on your monitor that will be attractive at different sizes. If you prefer that the proportion of text to graphics on your chart will look exactly the same as the chart gets bigger or smaller, you should move the slider toward the Proportional end. If you like your text to stay one size while the charting area gets bigger or smaller, move the slider toward the Fixed end.
The font sizes set on the Fonts tab are based on a chart size of 800 by 600 pixels. Keep in mind that the system automatically maximizes most charts to fill the screen before printing, sending to HTML, etc., so changes you make on this screen may affect the appearance of your printed charts.
To modify this setting, click the slider and drag it to the right or left, or click your mouse in the area to the right or to the left of the slider. If you want to return to the setting originally shipped with the software, click Default.