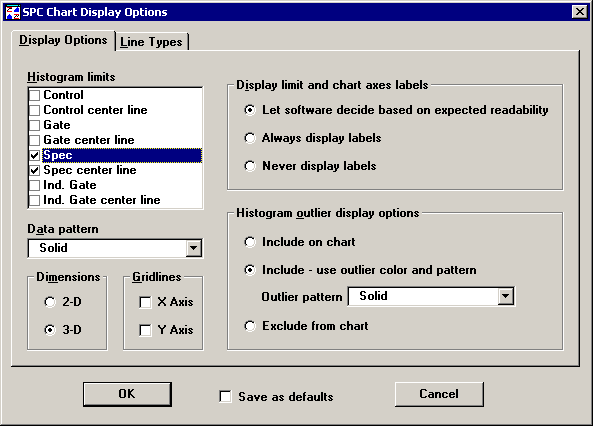
The normal SPC Chart Display Options screen.

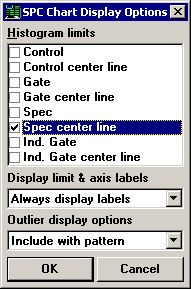
The SPC Chart Display Options screen in PDA mode at 240 by 320 pixels.
When a histogram is displayed on your screen, you can set options such as which limits are displayed, how the x-axis is labeled, and how lines are drawn.
To set these limits and more, right-click on the histogram and then click Display Options. Alternately, choose Display Options from the Options menu (in the SPC Charts and Reports module) or from the Chart Options menu (in the SPC Data Entry module) .
|
|
|
The normal SPC Chart Display Options screen. |
|
|
|
The SPC Chart Display Options screen in PDA mode at 240 by 320 pixels. |
On the Display Options tab, you can select the control, gate, spec, or individual limits to display on the chart.
On this tab, you can also select your outlier display. If you click on “Include on chart,” you will not be able to see a distinction between outliers and normal data. If you click on “Include - use outlier color and pattern,” you can display your outliers with a different color or pattern from the color and pattern of your other data. If you click on “Exclude from chart,” the histogram will not display the outliers at all.
Other options available on this tab are whether you want your data display to have a two-dimensional or three-dimensional appearance. Click on 2-D or 3-D in the “Dimensions” box to select the display you want. (In PDA mode, these options are not available.)
By choosing a patterned display rather than a solid display for your data bars, you will use much less ink when you print your histogram. (In PDA mode, this option is not available.)
You may also choose to draw horizontal (X-axis) or vertical ( Y-axis) lines on the chart. (In PDA mode, these options are not available.)
|
|

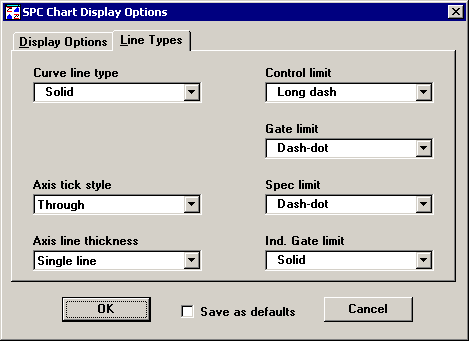
On the Line Types tab, you can select the line types for control, gate, spec, individual limits, histogram curve, and axis. (In PDA mode, these options are not available.)
To save your options as the new default settings for this workstation, select the Save as defaults check box and then click OK. (In PDA mode, this check box is not available.)
|
|