Scaling a Combined Control Chart can make the chart's data more meaningful.
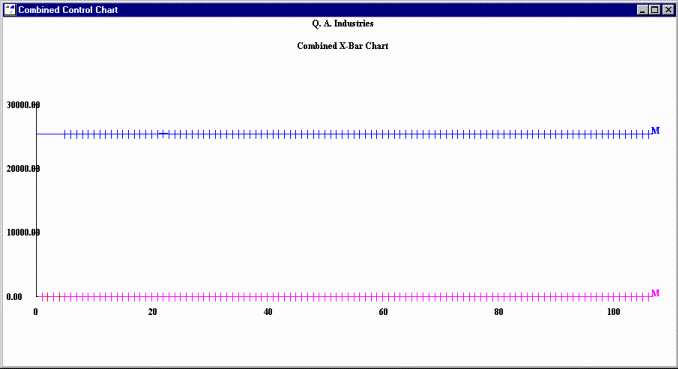
For example, a Combined Control Chart that is not scaled to normalize the measurement values may be of little value, as in the following example:
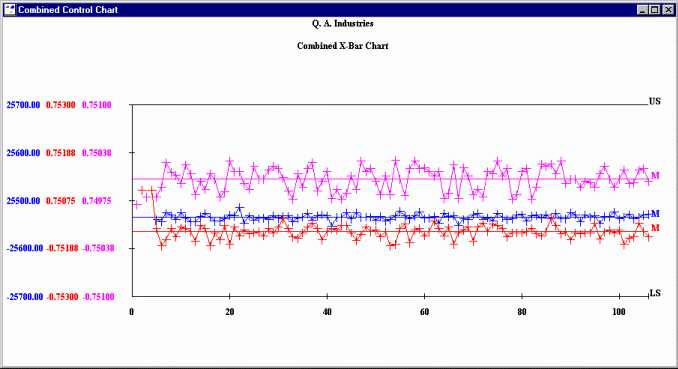
However, scaling the chart to the specification limits of each standard produces a more helpful chart:
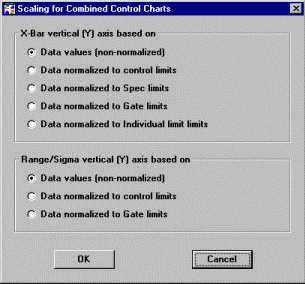
To change the scaling of a combined control chart, right-click on the chart and then click Scaling. Alternately, choose Scaling from the Options menu.
Non-normalized scaling simply plots the data points based their numeric value, as in the first example above.
Normalized scaling plots each data point in a retrieval group relative to the limits you select. Depending on your settings, it may also display those values on the left side of the chart - as in the second example above.
Although you can choose different scaling methods for the X-Bar and Range charts, you may find the charts to be most easily understood when scaled by the same method.
After specifying the type of scaling to use for X-bar charts and for Range or Sigma charts, click OK. This updates the cmb_control_xbar= and cmb_control_range= Cms.ini entries to make these settings the new default options for Combined Control Charts generated at this workstation.
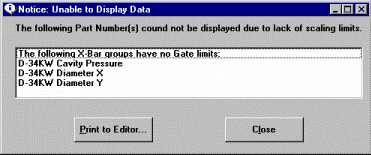
If you scale the X-bar or Range chart to Spec limits, Gate limits, or Individual limits, any retrieval group lacking these limits will be removed from the chart and listed on a message like the following: