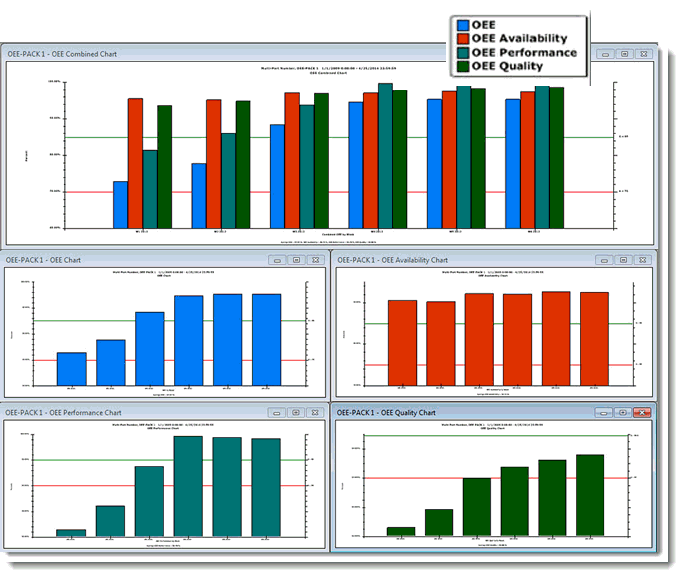
The OEE (Overall Equipment Effectiveness) chart percentage is calculated from the three OEE submetric percentages: Availability * Performance * Quality.
This example of an OEE chart has a display Chart Skin applied.

You can also display the OEE chart along with individual charts for Availability, Performance, and Quality to see the percentages used to calculate the OEE percentage. These charts can be stored on a retrievable desktop. You can also assign a specific color for each OEE metric. These colors carry over to the OEE Combined Chart as shown in the following image.
