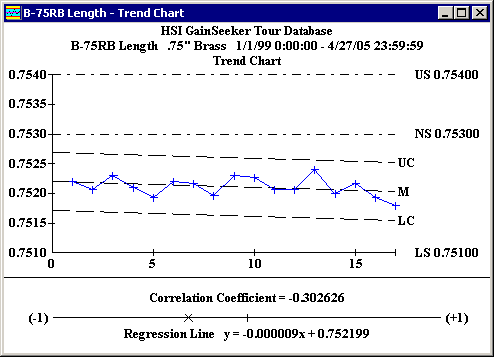
Like the Scatter Chart, the Trend Chart plots data points to detect trends. Both control limits and the mean are calculated from the linear regression line. By knowing the trend of a process, you can better predict when it will run outside gate limits or specifications.
