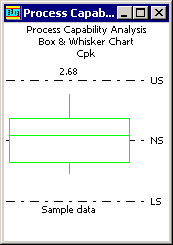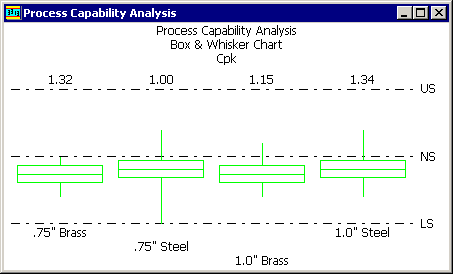
Box and Whisker charts are useful for determining the distribution of individual data by quartiles.
The center of the box is located on the median data value.
The top and bottom of the box are located on the third and first quartiles. The first quartile is the median of the lowest half of all the data, and the third quartile is the median of the highest half of all data.
The ends of the whisker are the extremes of the data.
Example
For a sample data set of the values 9, 11, 12, 15, 18, 20, 22, 23, 25, 29, 32, the Box and Whisker chart is displayed as follows:
The median of all values is 20, represented by the centerline of the box.
The first quartile is 12 and the third quartile is 25. The first and third quartiles are represented by the top and bottom of the box.
The low whisker represents the lowest number in the data set (9) to the first quartile, while the high whisker represents the values from the third quartile to the largest number in the data set (32).

How to generate a Box & Whisker chart for multiple standards
Log in to the SPC Charts and Reports module.
Click Quick Chart.
For the chart type, click Multiple Capability or Box & Whisker.
Select the standards to be analyzed.
Click Next.
Change the date range or select a filter if needed.
Click Finish.
If the Process Capability chart is not displayed in the Box & Whisker format:
Right-click on the chart, or click the Options menu.
Click Display Options.
In the Graph type list, click Box & Whisker, and then click OK.

How to generate a Box & Whisker chart for multiple traceability filters on one standard
Log in to the SPC Charts and Reports module.
Click Chart Designer.
Click Multiple filters, and then click OK.
Select the traceability filters, and then click Next.
For the chart type, click Multiple Capability or Box & Whisker.
Select the standard to be analyzed.
Click Next.
Change the date range or select a filter if needed.
Click Finish.
If the Process Capability chart is not displayed in the Box & Whisker format:
Right-click on the chart, or click the Options menu.
Click Display Options.
In the Graph type list, click Box & Whisker, and then click OK.
How to generate a Box & Whisker chart for multiple date ranges on one standard
Log in to the SPC Charts and Reports module.
Click Chart Designer.
Click Multiple date ranges, and then click OK.
Select the date ranges, and then click Next.
For the chart type, click Multiple Capability or Box & Whisker.
Select the standard to be analyzed.
Click Next.
Change the date range or select a filter if needed.
Click Finish.
If the Process Capability chart is not displayed in the Box & Whisker format:
Right-click on the chart, or click the Options menu.
Click Display Options.
In the Graph type list, click Box & Whisker, and then click OK.