Variation Wizard – Level Two
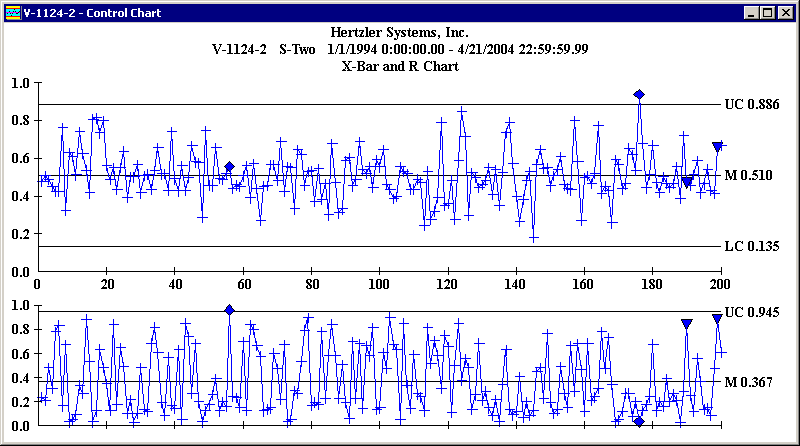
Here is an example of a level two analysis for the following chart:

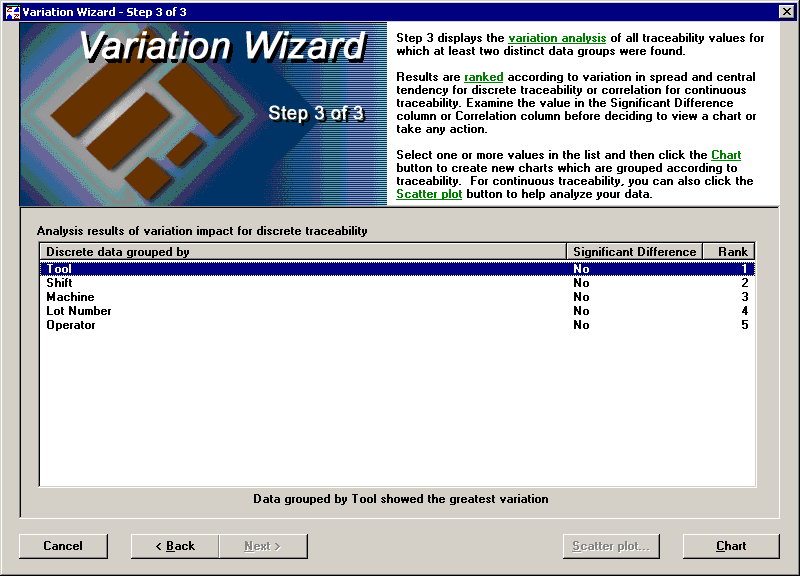
The first time the Variation Wizard was run, we obtained the following results, which showed no significant variation for any traceability.
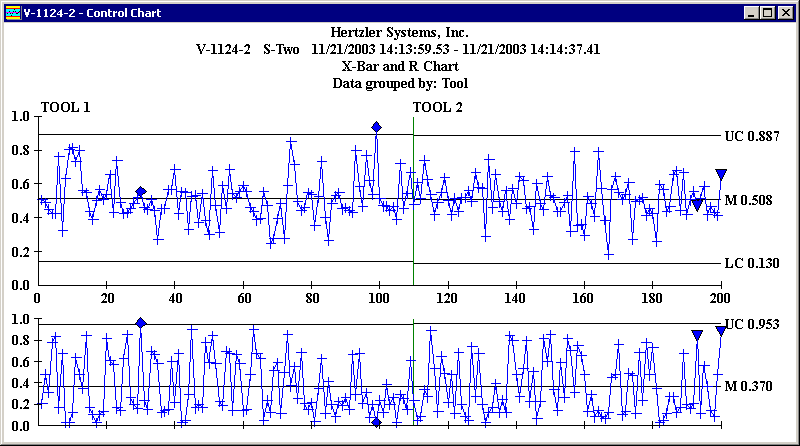
Viewing a chart for the highest ranked traceability item supported this conclusion.
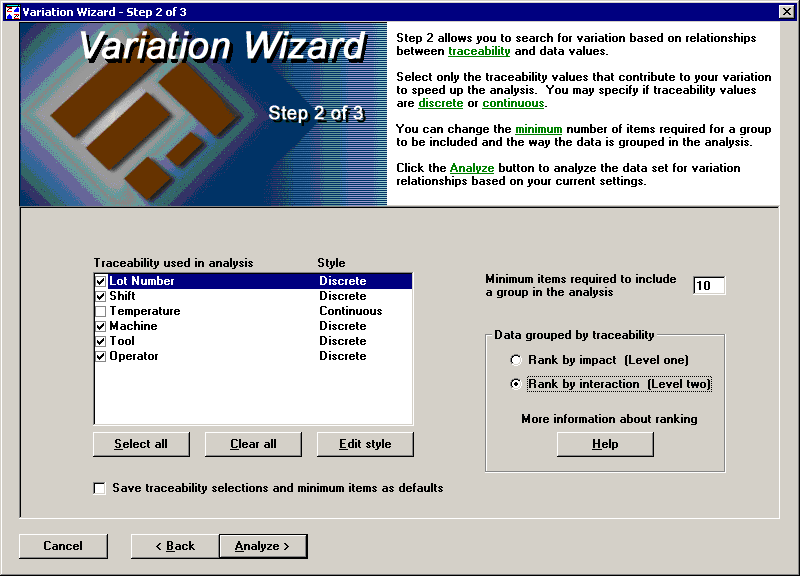
Subsequently, we returned to the second step of the Variation Wizard and chose the level two analysis.
This time the results are as follows:
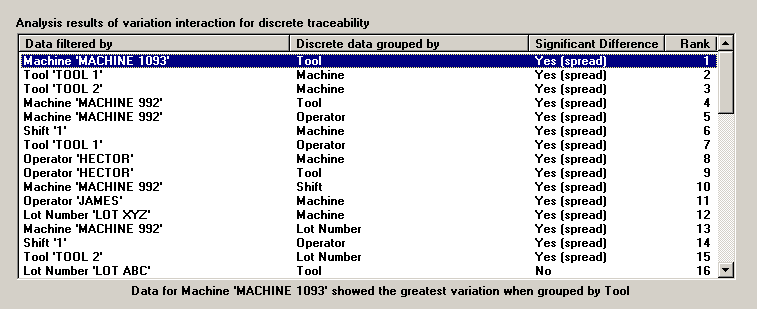
Expanding the analysis to the second level shows that there are fifteen items that are judged to be significant. The top item in the list is generated from the data set where we only look at the data for Machine 1093 (Machine 1093 is the filter) and group it by Tool. As is readily apparent from the chart below, Machine 1093 performs better when run with Tool 2. Thus, the chart visually shows why this combination of values is included at the top of the list.
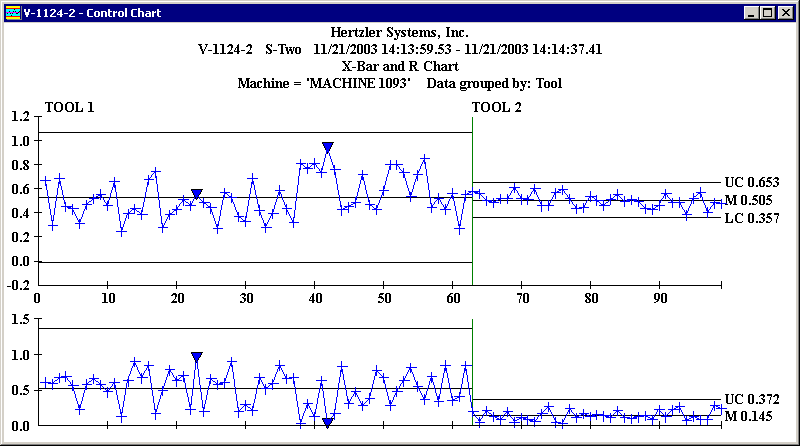
In this case, patterns in the data that are not readily apparent at the level one data grouping become obvious when viewed at the second level of data grouping.