![]() Note: If you select more text than there is space to display it, the labels will run off the page. Be selective in choosing the most important elements to display. The Chart titles preview field will help you with this.
Note: If you select more text than there is space to display it, the labels will run off the page. Be selective in choosing the most important elements to display. The Chart titles preview field will help you with this.
DMS charts have several types of labels. The three labels at the top of the chart (called the Title, Subtitle and Chart-title labels) give information about the chart as a whole. You can change or modify these labels through the Options menu or by right clicking the mouse on the chart. Changes to x- and y-axis labels are discussed in Changing lines on a chart.
![]() Note: If you select more text than there is space to display it, the labels will run off the page. Be selective in choosing the most important elements to display. The Chart titles preview field will help you with this.
Note: If you select more text than there is space to display it, the labels will run off the page. Be selective in choosing the most important elements to display. The Chart titles preview field will help you with this.
The title, subtitle and chart title labels appear at the top of each chart.
Line one: The title defaults to what was established during setup in the Administration module, probably your company's name.
Line two: The subtitle automatically includes information about the choices that you used to create the chart, e.g., process, part number and date range.
Line three: The chart title automatically includes the type of chart you created.
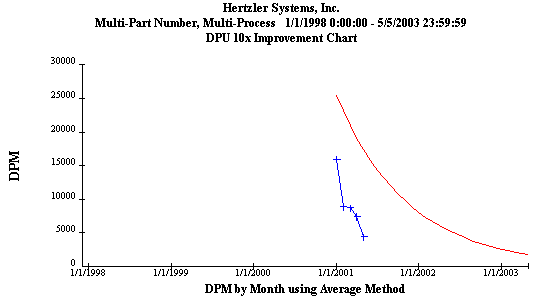
Right click your mouse button while the cursor is on a chart and select Chart Titles.
-- or--
Select Chart Titles from the Options menu.
The following screen will appear.
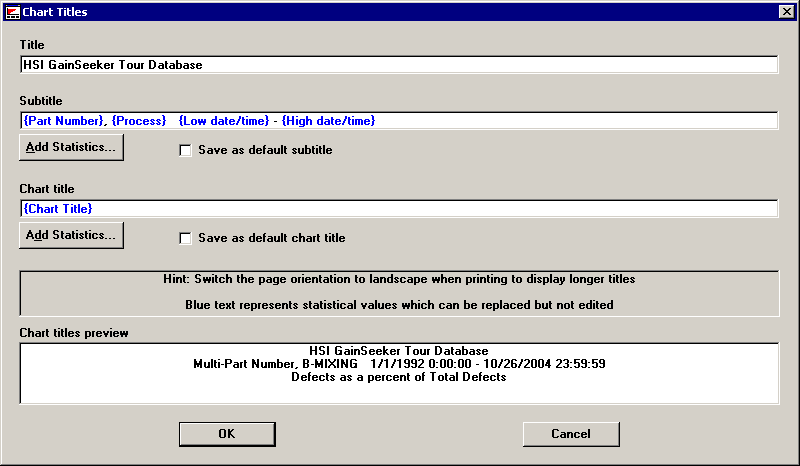
![]() Note: Changes made on the subtitle and chart title lines are saved in Cms.ini and are used as the default if you check the corresponding Save as default sub/chart title check box. Changes are also saved and remembered in desktops.
Note: Changes made on the subtitle and chart title lines are saved in Cms.ini and are used as the default if you check the corresponding Save as default sub/chart title check box. Changes are also saved and remembered in desktops.
Change or modify the title by entering new text in the Title field.
You can change the subtitle in several ways for an individual chart.
Change or modify the text in the Subtitle field.
To add text from a predefined list, click on Add Statistics.
The following dialog will appear.
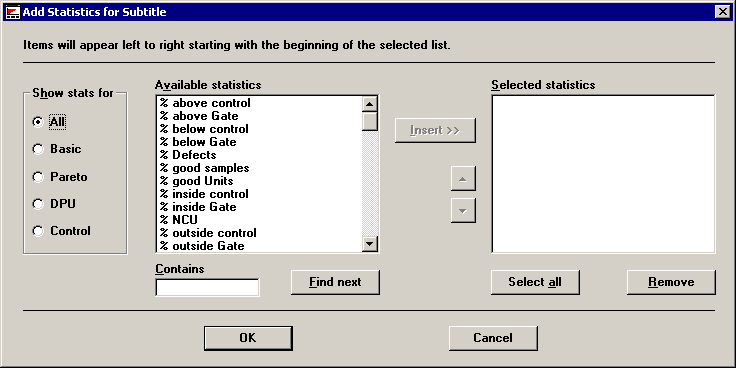
Choose the type of chart for which you would like to view the available statistics by choosing the appropriate radio button on the left and then move your desired statistics from the Available Statistics column to the Selected Statistics column with the Insert button and position them with the arrow keys. Click OK when you are satisfied with the statistics you have selected.
If you have a long list of statistics, use one of the following methods to locate the items you want.
Use the arrows to scroll through the list.
-- or--
Type one or more letters or numbers in the Contains box and click on Find next. Continue clicking on Find next to locate all the options with the letter or numbers you entered in the Contains box.
To change the default subtitle permanently, make your desired changes and select the Save as default subtitle check box on the Chart Titles dialog.

The default for the chart title is the type of chart you drew--Control, Pareto or DPU. To change the chart title:
Add to or modify the text in the box under Chart title.
Select predefined text by clicking the Add Statistics button. The resulting dialog is identical to the Add statistics for subtitle dialog and functions in the same way.
As you make changes to your title, subtitle and/or chart title, those changes are reflected in the Chart titles preview field on the Chart Titles dialog. Check it to make sure your titles will appear correctly on your charts before proceeding. After reviewing your possible changes, click OK to proceed or Cancel to disregard and return to the main module without any changes being made.

Single-click the statistic to select it.
![]()
Right-click the selected statistic and then click Format Value.
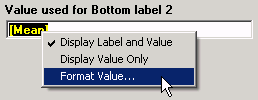
On the Format String screen, enter the format for this statistic. For valid format options, see Numeric formats, String formats and Date/Time formats.
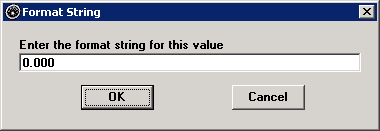
The format string is then displayed with the statistic.
![]()