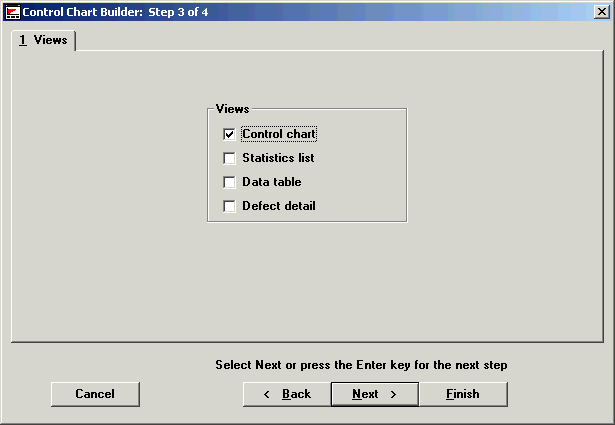
Step 3 in creating a Control chart is to select the chart view you want: a graphic Control chart, Statistics list, Data table or Defect detail list. You can create one or any combination of these four options. The default view is Control chart. (See the following screen.)
The Statistics list, Data table and Defect detail help you see the data used to produce the control chart.

The follow table explains what information the various chart views contain. (Note: your data table and defect detail lists may differ from the following examples.)
|
Views |
What information it contains |
|
Control chart |
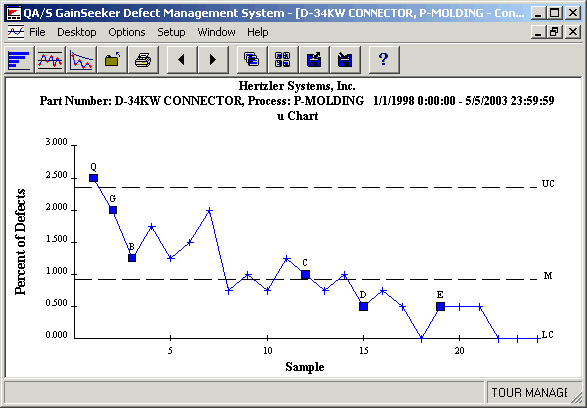
A chart showing if your defects are within your control limits. |
|
Statistics list |
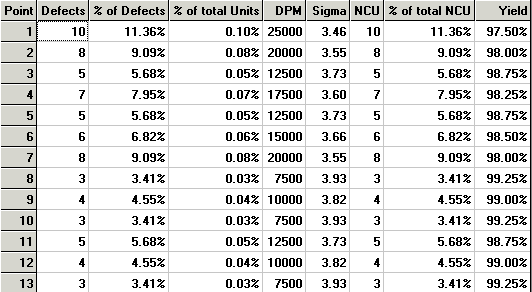
A table displaying statistics you have chosen as relevant for your data. |
|
Data table |
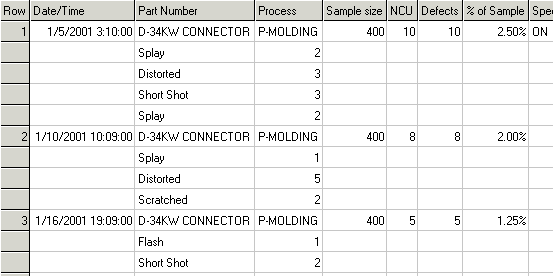
Shows the data used to create the chart:
|
|
Defect detail list |
Contains the information that goes into making the plot point for a chart:
|
On a control chart, the defect data is plotted over time. Statistical control limits are calculated and plotted with the data.
A typical control chart

A portion of a data table
The data table is useful for reviewing how data was actually entered and seeing the details of each data record.

A portion of a defect detail table
The statistics available for any given chart point can also be reviewed in table format.
