To launch one of the chart builders, follow these three steps.
Select the type of chart you want to draw. GainSeeker DMS consists of three different chart families: Control, Pareto and Defects Per Unit (DPU). Within each family, you can draw many variations on these charts either by creating different presentation forms or by grouping data differently.
Determine the number of processes and/or parts you want to retrieve. The place you start determines the top level of your retrieval. (If you are drawing a control chart, you don’ t need this step.)
Use the appropriate chart builder to specify what data your chart will retrieve.
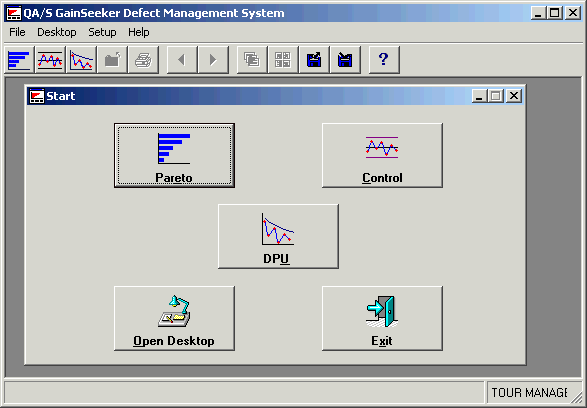
From the Start screen, taskbar icon or File menu, select the type of chart you want to draw: Control, Pareto or DPU.
The Start screen displays the three chart types and an option to open a desktop. If the Start screen does not load after you log in, you may create it from the Desktop menu using Define Start Buttons. Then display it with the option Show Start Buttons from the Desktop menu.

|
What it does |
|
|
Control |
Displays defects within parameters you have established and whether they are increasing or decreasing. |
|
Pareto |
Displays your biggest problem area. |
|
DPU |
Displays the improvement of you processes in relation to your improvement goal. |
Here are examples of the three chart types.
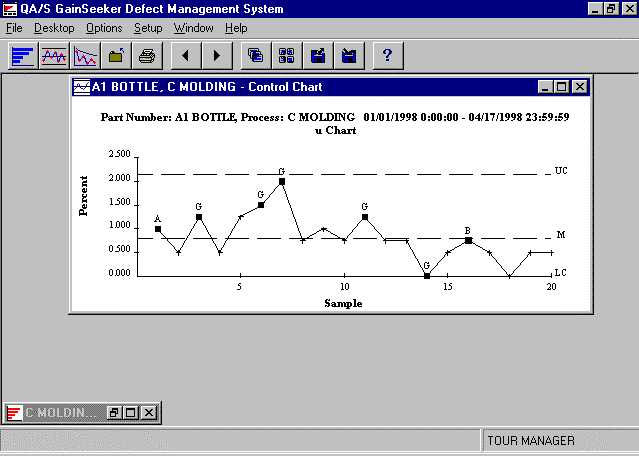
A Control Chart for one part
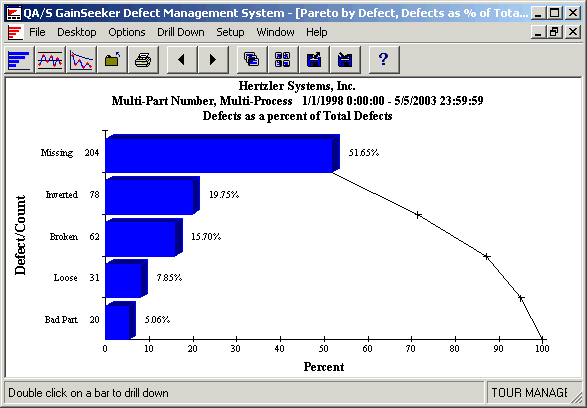
Example of a Pareto chart.
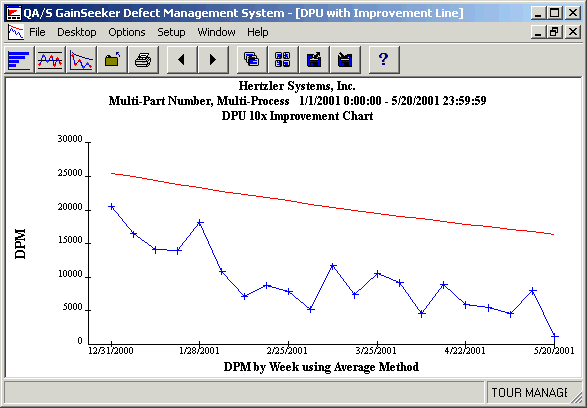
Example of a DPU chart.
The chart builders give you several ways to analyze your data. Your choice of which method to use depends on the type of analysis you want to do.
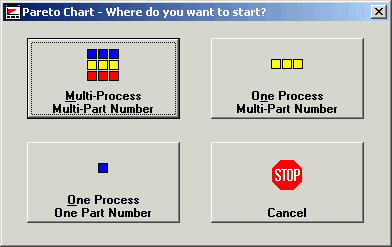
Will you be looking at one or many processes? Are you interested in one or many part numbers? Your choice will determine the top level of your retrieval.
The initial screen of the Control Chart Builder.
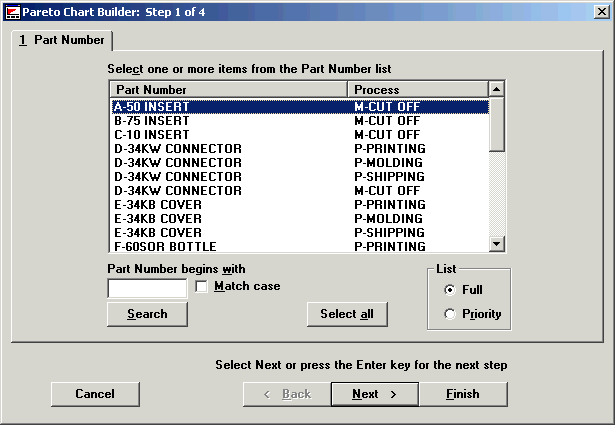
You can draw many variations of these charts, either in different presentation forms or by grouping data in different ways.
For Pareto and DPU charts, if you want to see the big picture, choose Multi-Process, Multi-Part Number. (The resulting chart will have all data on one chart.)
For Pareto and DPU charts, if you want to examine one process in depth, choose One Process, Multi-Part Number. (The resulting chart will have all data on one chart.)
For Pareto and DPU charts, if you want to examine a specific part of your operation in depth, choose One Process, One Part Number. For Control charts, select one process and one part number. (The resulting chart will have data on separate charts.)
The chart builders give you many options for refining your retrieval. These options include:
Selecting the date range.
Selecting specific defects.
Specifying various filters.