Calculations for process capability include Z values, predictions of percentage outside specification, and capability indexes. Cpk, Cp, and CR use the Factors Method for standard deviation. Ppk, Pp, and PR use the SSD Method for standard deviation.
The Cpk index is used to reflect the relative probability of making a part outside the specification limits. A negative Cpk indicates the mean fell outside of the specification limits (SL).
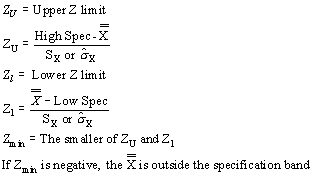
The Z value that is used in calculating process capability is the distance of the process average from the specification limits measured in standard deviation units.
For unilateral tolerance, calculate:

Absolute value in case SPEC < ![]() .
.
For bilateral tolerances, calculate:

Z is used with a standard distribution table to estimate the proportion of output that is beyond any specification. This table can be found in Appendix C in the Ford Motor Company's manual Continuing Process Control and Process Capability Improvement, page 54.
The most frequently used capability index is Cpk. GainSeeker SPC automatically calculates Cpk in one of three ways, depending on how the data is distributed. There are several different types of data distributions: normal, non-normal that can be modeled by Pearson's formula, and non-normal that cannot be modeled by Pearson's formula. For a complete description of these formulas, see Flow Chart Analysis of Non-Normal Data.
Pearson's formula
Pearson's equation is based on the first four moments of the parent distribution. These moments are used to develop a probability density formula. This formula accurately models univariate distributions that are valid only if the distribution is in a state of statistical control. Out-of-control points are not used in the calculation of the moments and, therefore, are not explained by the probability density function. This formula must explain all the values that come from in-control data. If the predictions of this equation do not explain the data from the population that was used to generate the moments, you are studying a multivariate distribution. Probability cannot be assessed. You must find the different sources of variation that you are grouping into one population and analyze them separately. The GainSeeker SPC database can be very helpful in this task.
Calculating Cpk for normal distributions:

A process with a ![]() , with a +/-3 sigma capability, would have a capability index of 1.00.
, with a +/-3 sigma capability, would have a capability index of 1.00.
This procedure is valid only if the underlying distribution is normally distributed.
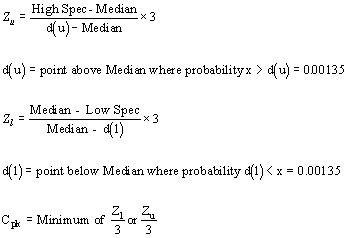
Calculating Cpk for non-normal, modeled distribution according to the Median method:
If you choose the Median method (which is the default method), GainSeeker evaluates the data distribution based on the median of the data.

Calculating Cpk for non-normal, modeled distribution according to the Probability method:
If you choose the Probability method and the data can be modeled, GainSeeker estimates the probability of being out-of-specification. It then determines what Z value would provide an equivalent probability of being outside the specifications on a normal curve. This Z value is then divided by 3. The corresponding value is now an actual probability or capability statement.

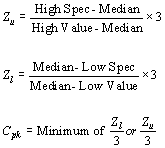
Calculating for Cpk for non-normal, not-modeled distribution:

Calculating Ppk
Ppk is the performance index that is based on the Sample Standard Deviation.
Ppk:
![]()
or
![]()
Choose whichever is smaller.
Calculating Cp (Process potential--centered Capability Index)
Cp = Capability Index (centered)
![]()
Cp is the best possible Cpk value for the given ![]() .
.
Calculating Centered Capability Indexes with Unilateral Specifications:
If there exists an upper specification only the following equation is used:
![]()
If only the lower specification exists then the following equation is used:
![]()
However, if the Cpk is larger than Cp, the target is probably poorly chosen and not centered. If this is the case, Cp is set to Cpk and both indexes report the same value.
Cr for unilateral specification is the inverse of Cp or
![]()
Calculating Pp (Process potential--centered Performance Index)
![]()
Pp is the best possible Ppk value for the given Sx.
Calculating Cpm
When Cpm is used to assess process performance, it considers the proximity to the target value, as well as the process variation. This index is easy to compute and easy to analyze, and it has more desirable statistical properties than Cp and Cpk.

Calculating CR
CR=Capability Ratio
![]()
Calculating PR
PR=Performance Ratio for normal distributions only
![]()
![]() Estimated Standard Deviation (Factors Method)
Estimated Standard Deviation (Factors Method)
![]()
 = average of the averages or of individuals if subgroup size = 1
Sx = Sample Standard Deviation (SSD Method)
Chan, Lai K., Smiley W. Cheng, and Frederick A. Spiring. "A New Measure of Process Capability: Cpm." Journal of Quality Technology. July, 1988. Pages 162-164.
Ford Motor Company, Product Quality Office. Continuing Process Control and Process Capability Improvement. 1984. Pages 25, 26, 54.
Fundamental Statistical Process Control Reference Manual. AIAG. 1991.
Kane, Victor E. Intermediate SPC Training. Ford Motor Company. August, 1983. Page 9-4.
Bothe, Davis R. Measuring Process Capability. McGraw Hill. 1997. Page 119-126.
Fundamental Statistical Process Control Reference Manual. AIAG. 1991.
Kane, Victor E. Intermediate SPC Training. Ford Motor Company. August, 1983. Page 9-4.