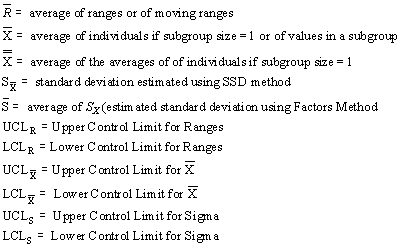
GainSeeker calculates control limits in several user-definable methods. You can calculate control limits for Range and ![]() charts using the Factors or Sample Standard Deviation (SSD) methods. When the subgroup size is one, the calculations are slightly different.
charts using the Factors or Sample Standard Deviation (SSD) methods. When the subgroup size is one, the calculations are slightly different.
 Factors method of calculating control limits for Range charts:
 Sample Standard Deviation method of calculating control limits:
 Factors method of calculating control limits for S charts:
 Non-symmetrical control limits:
Assumptions when calculating control limits:

|
Subgroup size |
A2 |
A3 |
B3 |
B4 |
E2 |
D3 |
D4 |
|
2 |
1.880 |
2.659 |
----- |
3.267 |
2.66 |
----- |
3.267 |
|
3 |
1.023 |
1.954 |
----- |
2.568 |
1.772 |
----- |
2.574 |
|
4 |
0.729 |
1.628 |
----- |
2.266 |
1.457 |
----- |
2.282 |
|
5 |
0.577 |
1.427 |
----- |
2.089 |
1.290 |
----- |
2.114 |
|
6 |
0.483 |
1.287 |
0.030 |
1.970 |
1.184 |
----- |
2.004 |
|
7 |
0.419 |
1.182 |
0.118 |
1.882 |
1.109 |
0.076 |
1.924 |
|
8 |
0.373 |
1.099 |
0.185 |
1.815 |
1.054 |
0.136 |
1.864 |
References:
Boyd, D.F. "Applying the Group Chart for ![]() and R." Industrial Quality Control.
and R." Industrial Quality Control.
Ford Motor Company, Product Quality Office. Continuing Process Control and Process Capability Improvement. 1984. Pages 14, 33.
General Motors Corporation. General Motors Statistical Process Control Manual. August, 1984. Page 4-4.
Grant, Eugene L. and Richard S. Leavenworth. Statistical Quality Control, Fifth Edition. McGraw-Hill Book Company, 1980. Pages 79 - 81.