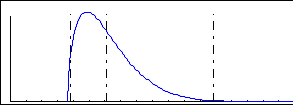
Sometimes you may want to display non-symmetrical control limits for a data set that has a subgroup size of one and a non-normal distribution. The following example displays such a case:

The chart on the left shows a normal distribution with symmetrical control limits. The chart on the right shows a non-normal distribution with symmetrical limits. Notice that there is a good chance of points outside the upper control limit and no chance of a point falling below the lower control limit. For the data set shown, 1.2% of the data was found to be above the upper control limit.
 The chart to the right shows the same non-normal distribution with non-symmetrical limits. Now the chance of a signal above the upper control limit is sharply reduced and there is a chance that some points may fall below the lower control limit.
For the data set shown, only 0.2% of the data was found to be above the upper control limit and 1.2% was found to be below the lower control limit. Since the process has a natural lower boundary, any failures below the lower control limit can be ignored, which results in a failure rate reduction of 83%.
When non-symmetrical control limits are applied to a data set, the zones are calculated using 1/3 of the area between the mean and the control limit above and below. This allows non-symmetrical control limits to have zones of different widths above and below the mean.
GainSeeker calculates non-symmetrical control limits as follows:
UCLx = Mean + 3SD = point above mean where 0.135% of the data falls above this point
LCLx = Mean - 3SD = point below mean where 0.135% of the data falls below this point
For a more detailed explanation of how Mean +/- 3SD is calculated, see Flow Chart Analysis of Non-Normal Data.