When a control chart is displayed on your screen, you can change the way that data points are plotted relative to the y-axis of charts.
To change the scaling of a control chart, right-click on the chart and then click Scaling. Alternately, choose Scaling from the Options menu (in the SPC Charts and Reports module) or from the Chart Options menu (in the SPC Data Entry module) .
This feature is not available in PDA mode or for MINITAB chart windows.

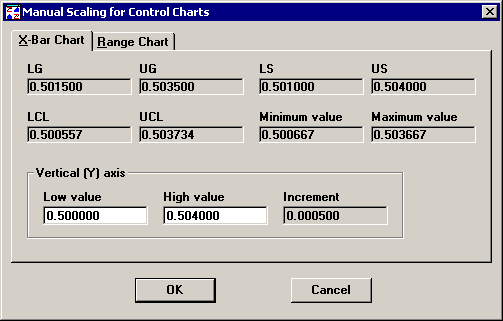
At the top of the X-Bar Chart tab, the program displays the gate limits ( LG and UG), specification limits ( LS and US), control limits ( LCL and UCL), and the maximum and minimum data values for the current chart. You may want to consider these values when you adjust the scaling for the y-axis of the chart.
To manually scale the end points of the chart's y-axis, enter the Low value and High value you want to use. Based on the values you enter, the program will automatically calculate the increment for labeling the y-axis.
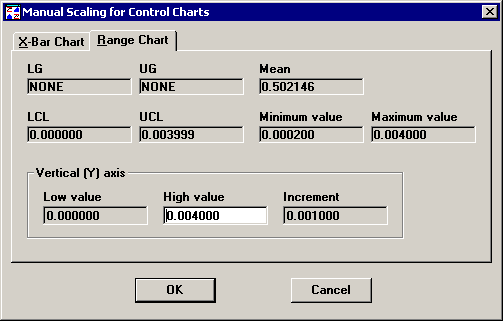
The Range Chart tab works similarly to the X-Bar Chart tab, except that the Low value is automatically set to 0 and the mean (R-bar) is displayed instead of specification limits.
