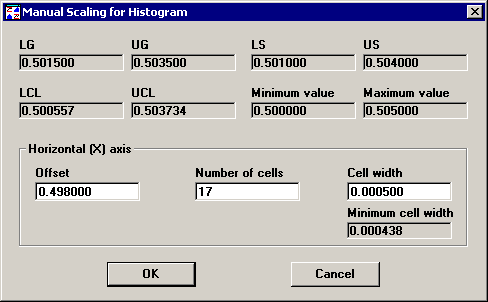
When a histogram is displayed on your screen, you can change the way that data is plotted relative to the y-axis of charts.
To change the scaling of a histogram, right-click on the chart and then click Scaling. Alternately, choose Scaling from the Options menu (in the SPC Charts and Reports module) or from the Chart Options menu (in the SPC Data Entry module) .
This feature is not available in PDA mode or for MINITAB chart windows.

At the top of the histogram scaling dialog, you can get a precise reading of the values shown on the histogram. At the bottom of the dialog, you can type in different values for the Offset, Number of Cells, and Cell width. The program calculates the Minimum cell width based on the number of cells that you choose.