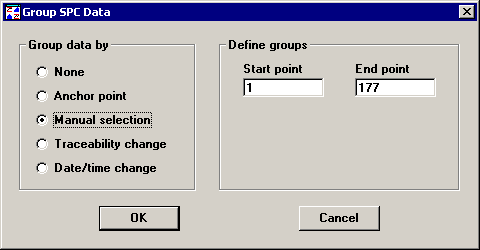
You can select specific subgroups on your chart to mark the beginning and end of data groups. To use this feature, click Manual selection. (In PDA mode , this option is not available.)

Initially, the Define groups area displays only the first and last subgroups on your chart.
To divide your control chart into data groups, determine which subgroup should mark the end of the first data group, and then enter that number in the End point box.
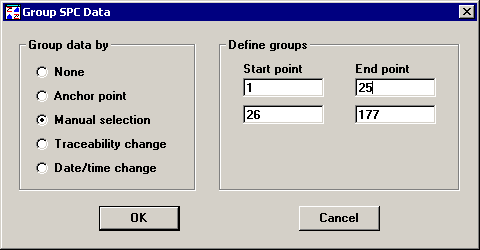
For example, if you want for the first data group to contain the first 25 subgroups of data, type 25 in the End point box. The program automatically defines a second data group for the remainder of the data.

Each row on this screen defines the beginning and end points of a data group. You can continue to enter numbers in the Start point and End point boxes until you are satisfied with the data groups. The program will automatically add or subtract rows so that all of the data subgroups on your control chart are included in a data group. After setting up as many data groups as you want, click OK to draw the chart displaying data groups.