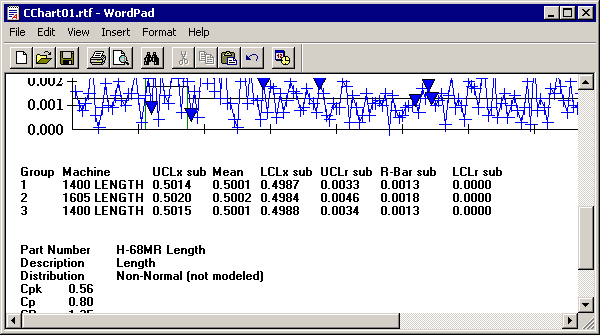
If you print a control chart with two or more data groups, or if you send such a chart to HTML, to an editor such as WordPad, or to another application as an *.rtf file, the data group control limit legend will be printed immediately after the chart followed by the statistics chosen to print after the chart.
