|
Contents [Hide] |

Every module that generates Control charts or Performance charts can automatically scale the y-axis of the chart so that all of the data points in the retrieval are visible. Depending on your retrieval and statistical settings and on the data points retrieved, the same standard may be exhibit different scaling on the y-axis for charts generated at different times.
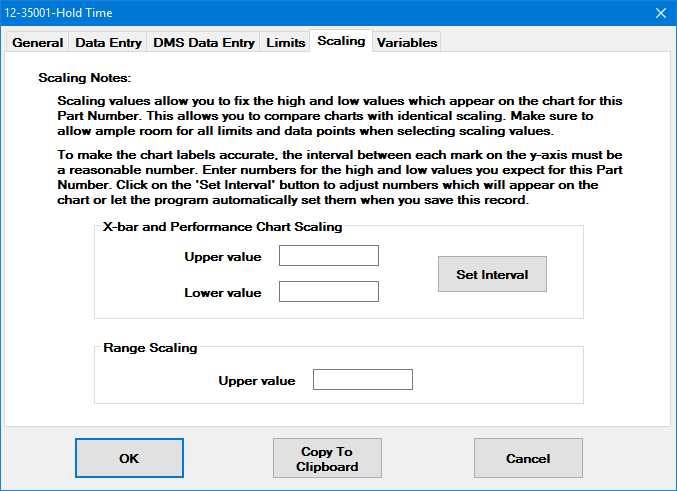
To force the X-bar and Performance Charts for this standard to use a consistent y-axis scaling, specify both an upper y-axis value for Upper value and a lower y-axis value for Lower value. Similarly, you can specify an upper y-axis value for Range, Moving Range and Sigma charts by entering the value in Range Scaling.
The program may need to slightly adjust the high and low values you entered so that the plotted high and low values on the chart – as well as the intervals between them – are reasonably round numbers. To view the adjustment and fine-tune your settings, click Set interval. The program will automatically adjust the numbers (if necessary) when you click OK to save the standard, even if you do not click Set interval.
|
|