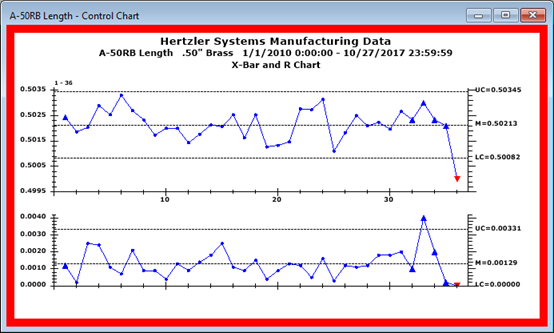
Use the Real-time failure border settings to enable colored chart borders that indicate the presence of real-time failures on those charts.

 Note: These
and all other settings located in the Chart
overrides node of the Settings
dialog can be saved as a chart skin that you can apply to any charts.
For more information, see Chart Skins
|
Contents [Hide] |
To temporarily override any default settings for charts, navigate to the Real-time failure border settings on the Settings tab following this path:
Chart overrides | Charts | Real-time failure border
For help with using expandable tree structures, see Navigating Tree Structures
To set default settings for a configuration, navigate to the Real-time failure border settings following this path on the Configurations tab of the System Administration module:
Configurations | (Configuration Name) | Chart defaults | SPC | Real-time failure border
This setting enables or disables the colored chart border and determines which of the failures should set the color for the border.
Highest Priority - enables the chart border. Based on the number of Records to include, the chart border is set to the highest priority color of all the failures found in those records (or the 'Color used when no failure occurs' if there were no failures in those records).
Most Recent - enables the chart border. Based on the number of Records to include, the chart border is set to highest priority color of the most recent record with failures (or the 'Color used when no failure occurs' if there were no failures in those records).
Off - the chart border is not displayed.
The thickness of the border, in pixels.
How many of the most recent data records should be checked for real-time failures to determine which color will be displayed on the chart border.
To check all records on the chart, set this to 0.
All chart borders use the real-time failure colors defined in the System Administration module for the current configuration.