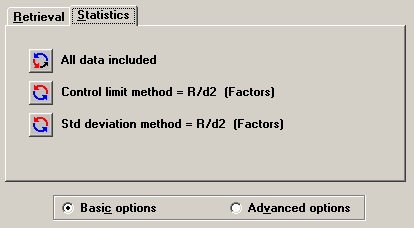
Basic options determine whether or not statistical outliers are included in the data analysis and which method to use when assessing standard deviation.
To set Basic statistics options, click the Statistics tab and then click Basic options.

The Statistics tab uses toggle buttons ![]() and
and ![]() to switch between the options available for each setting.
to switch between the options available for each setting.
The 1st button (including or excluding statistical outliers):
You may choose whether to include all data in your statistical analysis or whether to exclude statistical outliers. Outliers are observations that violate SPC rules for control, runs, trends and zones.
This button toggles between three options:
All data included
All data is included on charts and in statistical calculations.
Data outside Control Limits excluded
Data outside control limits will appear on charts but will not be included in statistical calculations such as Control limits or Cpk.
Out-of-Control, Runs, Trends and Zones excluded
Data that is outside control limits, in a run above or below the mean, in a trend increasing or decreasing, or exhibits too many points above or below 1 or 2 standard deviations will appear on charts but will not be included in statistical calculations such as Control limits or Cpk.
The 2nd button (Control limit method):
Choose a standard deviation method for calculating control limits. You can choose either Factors (R-Bar / d2) or Sample standard deviation. The Factors method provides the best prediction if your data exhibits more variation within subgroups than between subgroups, while the Sample standard deviation method provides the best prediction if your data exhibits more variation between subgroups than within subgroups.
The 3rd button (Std deviation method):
Choose a method for calculating standard deviation for other statistics. You can choose either Factors (R-Bar / d2) or Sample standard deviation. The Factors method provides the best prediction if your data exhibits more variation within subgroups than between subgroups, while the Sample standard deviation method provides the best prediction if your data exhibits more variation between subgroups than within subgroups.
The method you choose will be used to calculate the Mean +/- 3SD, Mean +/- 4SD, 6SD, Zl, Zu, and Cpm for data in a normal distribution.
More: