On the External Data from Clipboard screen, you can specify how many rows of data will make up one subgroup.
![]()
When creating one subgroup from multiple rows, the traceability and date/time stamp applied to each subgroup will be taken from the last row in that subgroup. If there are not enough rows to complete the last subgroup, one or more of the topmost rows in the Data from clipboard box will be ignored so that only complete subgroups will be displayed.
The following examples demonstrate how this works.
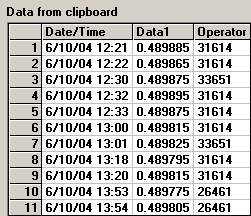
Example with one Data column

To analyze this data as subgroups of 1 (individuals data), set the Rows used to define one subgroup to 1. The resulting data table will look like  this:
this:
To analyze this data as subgroups of 2, set the Rows used to define one subgroup to 2. The resulting data table will look like  this:
this:
As only 5 complete subgroups of 2 could be created, the first data row in the Clipboard was ignored. Also, the date/time stamp and Operator applied to each subgroup come from the second Clipboard row for that subgroup.
To analyze this data as subgroups of 3, set the Rows used to define one subgroup to 3. The resulting data table will look like  this:
this:
As only 3 complete subgroups of 3 could be created, the first two data rows in the Clipboard were ignored. Also, the date/time stamp and Operator applied to each subgroup come from the third (most recent) Clipboard row for that subgroup.
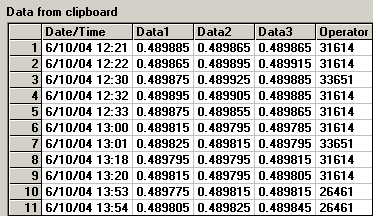
Example with three Data columns
The second example has three columns of data:

When analyzed at 1 row per subgroup, the resulting data table displays 11 subgroups of 3 data points each.
When analyzed at 2 rows per subgroup, the resulting data table displays 5 subgroups of 6 data points each. The first data row in the Clipboard is ignored because a complete subgroup of 6 data points cannot be created.
When analyzed at 3 rows per subgroup, the resulting data table displays 3 subgroups of 9 data points each. The first two data rows in the Clipboard are ignored because a complete subgroup of 9 data points cannot be created.
More: