Use the application best suited to your external data source to view a set of data and to copy it to the Windows Clipboard. For examples,  click here:
In the SPC Charts and Reports module, click the File menu, point to External Data, and click Clipboard.
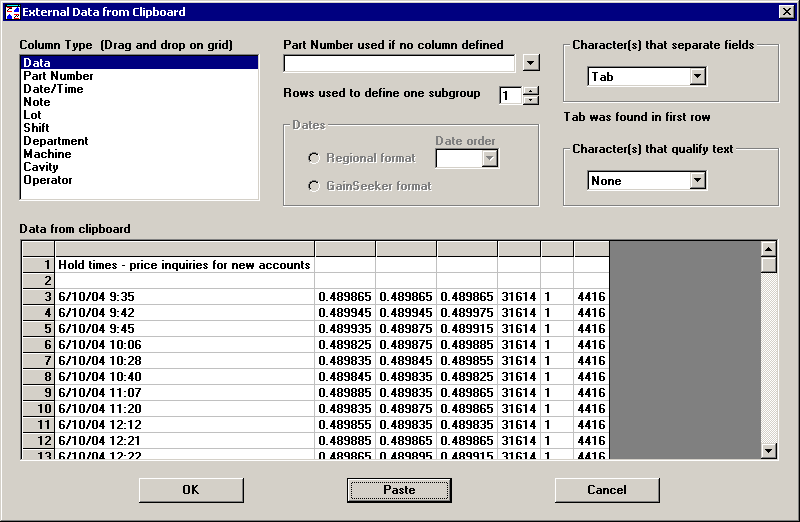
The data you have copied to the Clipboard will be displayed on the  External Data from Clipboard screen.
Verify that the data to be analyzed is correctly displayed in the Data from clipboard box, as in the example below.

If the data is not correctly displayed, use one or more of the following tools to correct the data:
-
If the data displayed on this screen is not the data you want to analyze, you can overwrite it with new data from the Clipboard. For more information, see Pasting new data from the Clipboard.
-
Based on the data you copied to the clipboard, GainSeeker attempts to automatically determine where columns are divided and how text values are formatted. If that determination is not correct, you can configure these settings to match your data. For more information, see Dividing columns and formatting text values.
-
If the Data from clipboard box displays any rows that should not be analyzed, such as header information, you should delete those rows from the box. For more information, see Removing unnecessary rows.
-
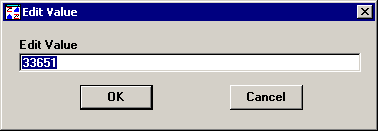
If an individual value in the Data from clipboard box is incorrect, you can manually change that value. Right-click on the cell to be changed, and then click Edit Value.

Type the correct value, and then click OK. -
If the Data from clipboard box displays any columns that should not be analyzed, you can hide these columns from display by right-clicking in each column and then clicking Hide Column. To display hidden columns, right-click anywhere on the grid and then click Show Hidden Columns.
For GainSeeker to correctly analyze your data, you must identify the type of information in each relevant column. At minimum, you must specify at least one Data column. For more information, see Specifying column types.
If any value in a Data column is missing, you should enter the asterisk character ( * ) for the missing value or just leave that value blank. Any other non-numeric values in this column will not allow this subgroup to be charted correctly.
Set the Rows used to define one subgroup to the number of data rows that should be combined into one subgroup. For more information, see Number of rows per subgroup.
If one of the columns you specified is the Date/Time column, GainSeeker attempts to automatically determine the order of month, day and year in the specified dates.

If the selected Regional format does not match the date/time stamps in your data, select the correct format from the Date order list. Or if your date/time stamps are formatted in the GainSeeker format of "yyyymmddhhnnssxx", select this option.
If you have not specified a column for Part Number, you must use the Part Number used if no column defined box to designate which standard to use. You may either choose a standard that already exists or specify a name for a new temporary standard:
-
To choose a standard that already exists, click the
 button to display the full list of standards. For more information on choosing a standard in the list, see Finding and selecting SPC standards.
 -
To specify a name for a new temporary standard, type the new name in the Part Number used if no column defined box.

After verifying your settings, click OK to proceed with data analysis.
If you specified a name for a new temporary standard that does not yet exist, or if standards do not exist for some of the values in your Part Number column, you will be prompted to set any options you want for each temporary standard, including the subgroup size and specification limits. For more information on setting these options, see Creating a new standard. The temporary standards you set up will be available for use until the Charts and Reports module is closed. After you have finished setting up the temporary standards, click OK.
A chart window for each standard is now displayed on the screen. For instructions on analyzing this data, see Analyzing external data.

